- Introduction
- prerequisites
- Passo 1: Provisionamento de dispositivo
- Passo 2: Conectar dispositivo
- Passo 3: Criar dashboard
- Passo 4. Configurar regras de Alarme
- Passo 5. Criar alarme
- Passo 6: Notificação de Alarmes
- Step 7. Assign Device and Dashboard to Customer
- ThingsBoard Community Edition education course
- Your feedback
Introdução
O objetivo deste tutorial é demonstrar o uso básico dos recursos fuse RETINA mais populares. Você vai aprender como:
- Conectar dispositivos a plataforma;
- Enviar dados de dispositivos para plataforma;
- Construir um dashboard real-time para o usuário final;
- Definir limiares e acionadores de alarmes;
- Push notifications about new alarms over email, sms or other systems.
We will connect and visualize data from the temperature sensor to keep it simple.
You will need to have ThingsBoard server up and running. The easiest way is to use Live Demo server.
The alternative option is to install ThingsBoard using Installation Guide. Windows users should follow this guide. Linux users that have docker installed should execute the following commands:
1
2
3
4
5
mkdir -p ~/.mytb-data && sudo chown -R 799:799 ~/.mytb-data
mkdir -p ~/.mytb-logs && sudo chown -R 799:799 ~/.mytb-logs
docker run -it -p 9090:9090 -p 7070:7070 -p 1883:1883 -p 5683-5688:5683-5688/udp -v ~/.mytb-data:/data \
-v ~/.mytb-logs:/var/log/thingsboard --name mytb --restart always thingsboard/tb-postgres
These commands install ThingsBoard and load demo data and accounts.
ThingsBoard UI will be available using the URL: http://localhost:8080. You may use username tenant@thingsboard.org and password tenant. More info about demo accounts is available aqui.
Passo 1: Provisionamento de dispositivo
For simplicity, we will provision the device manually using the UI.
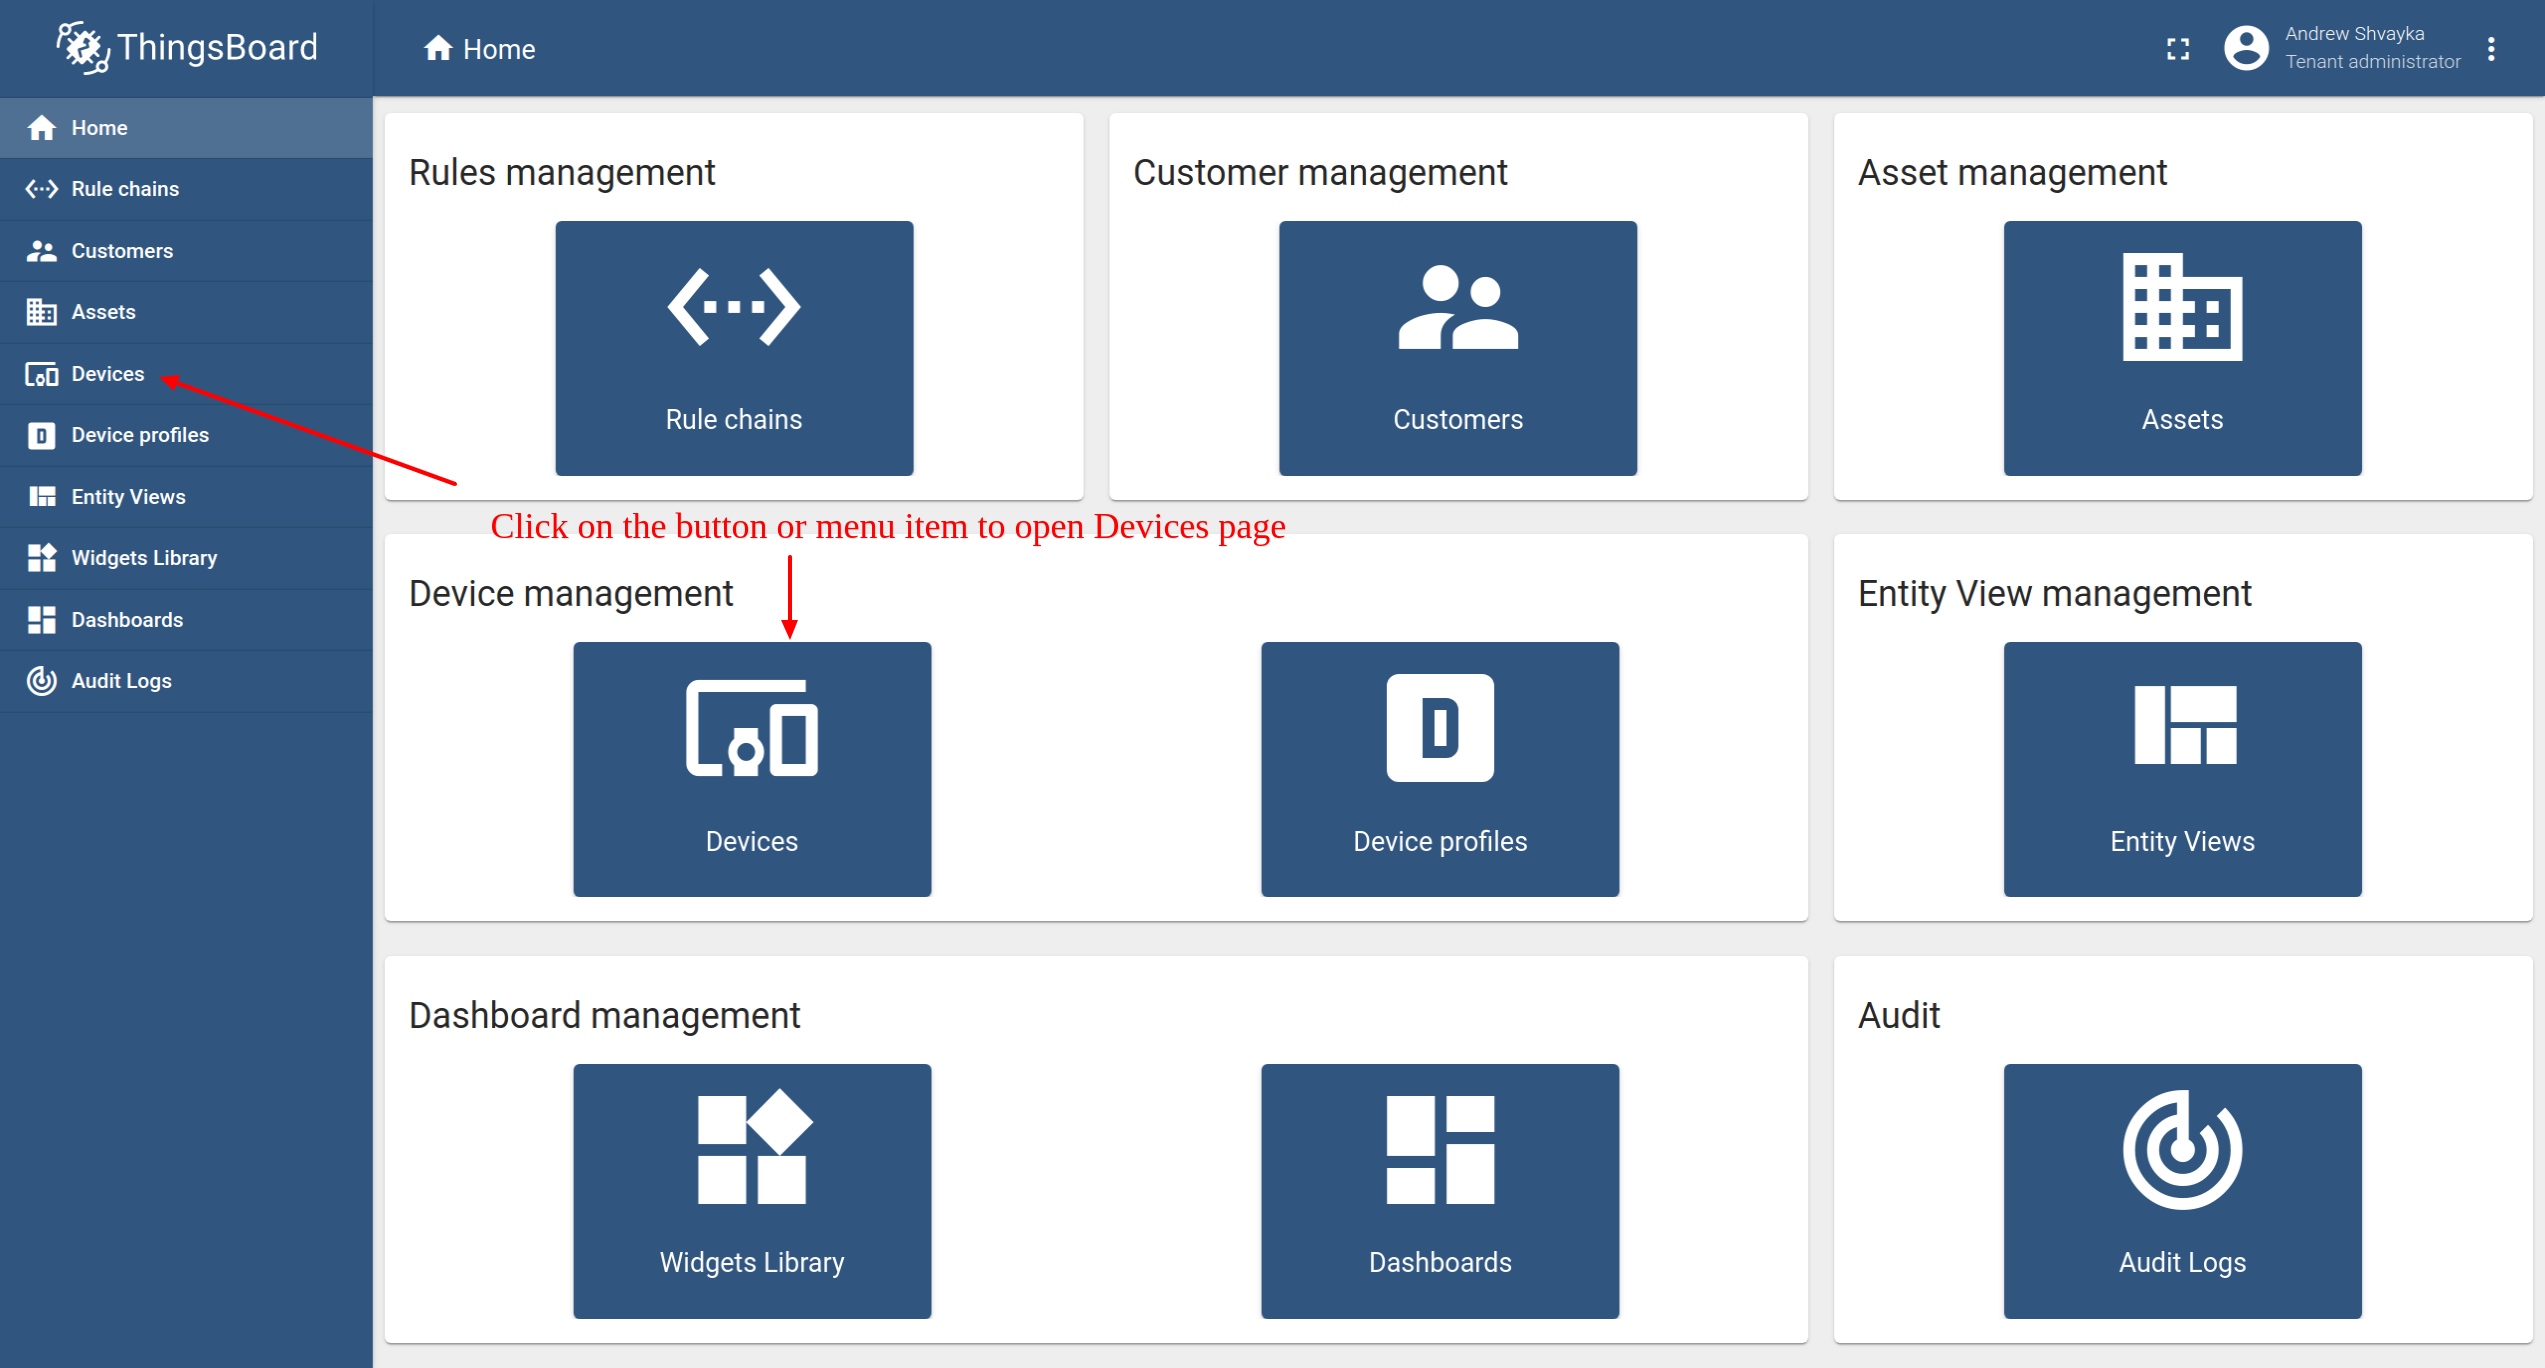
- Login to your ThingsBoard instance and open the Devices page.
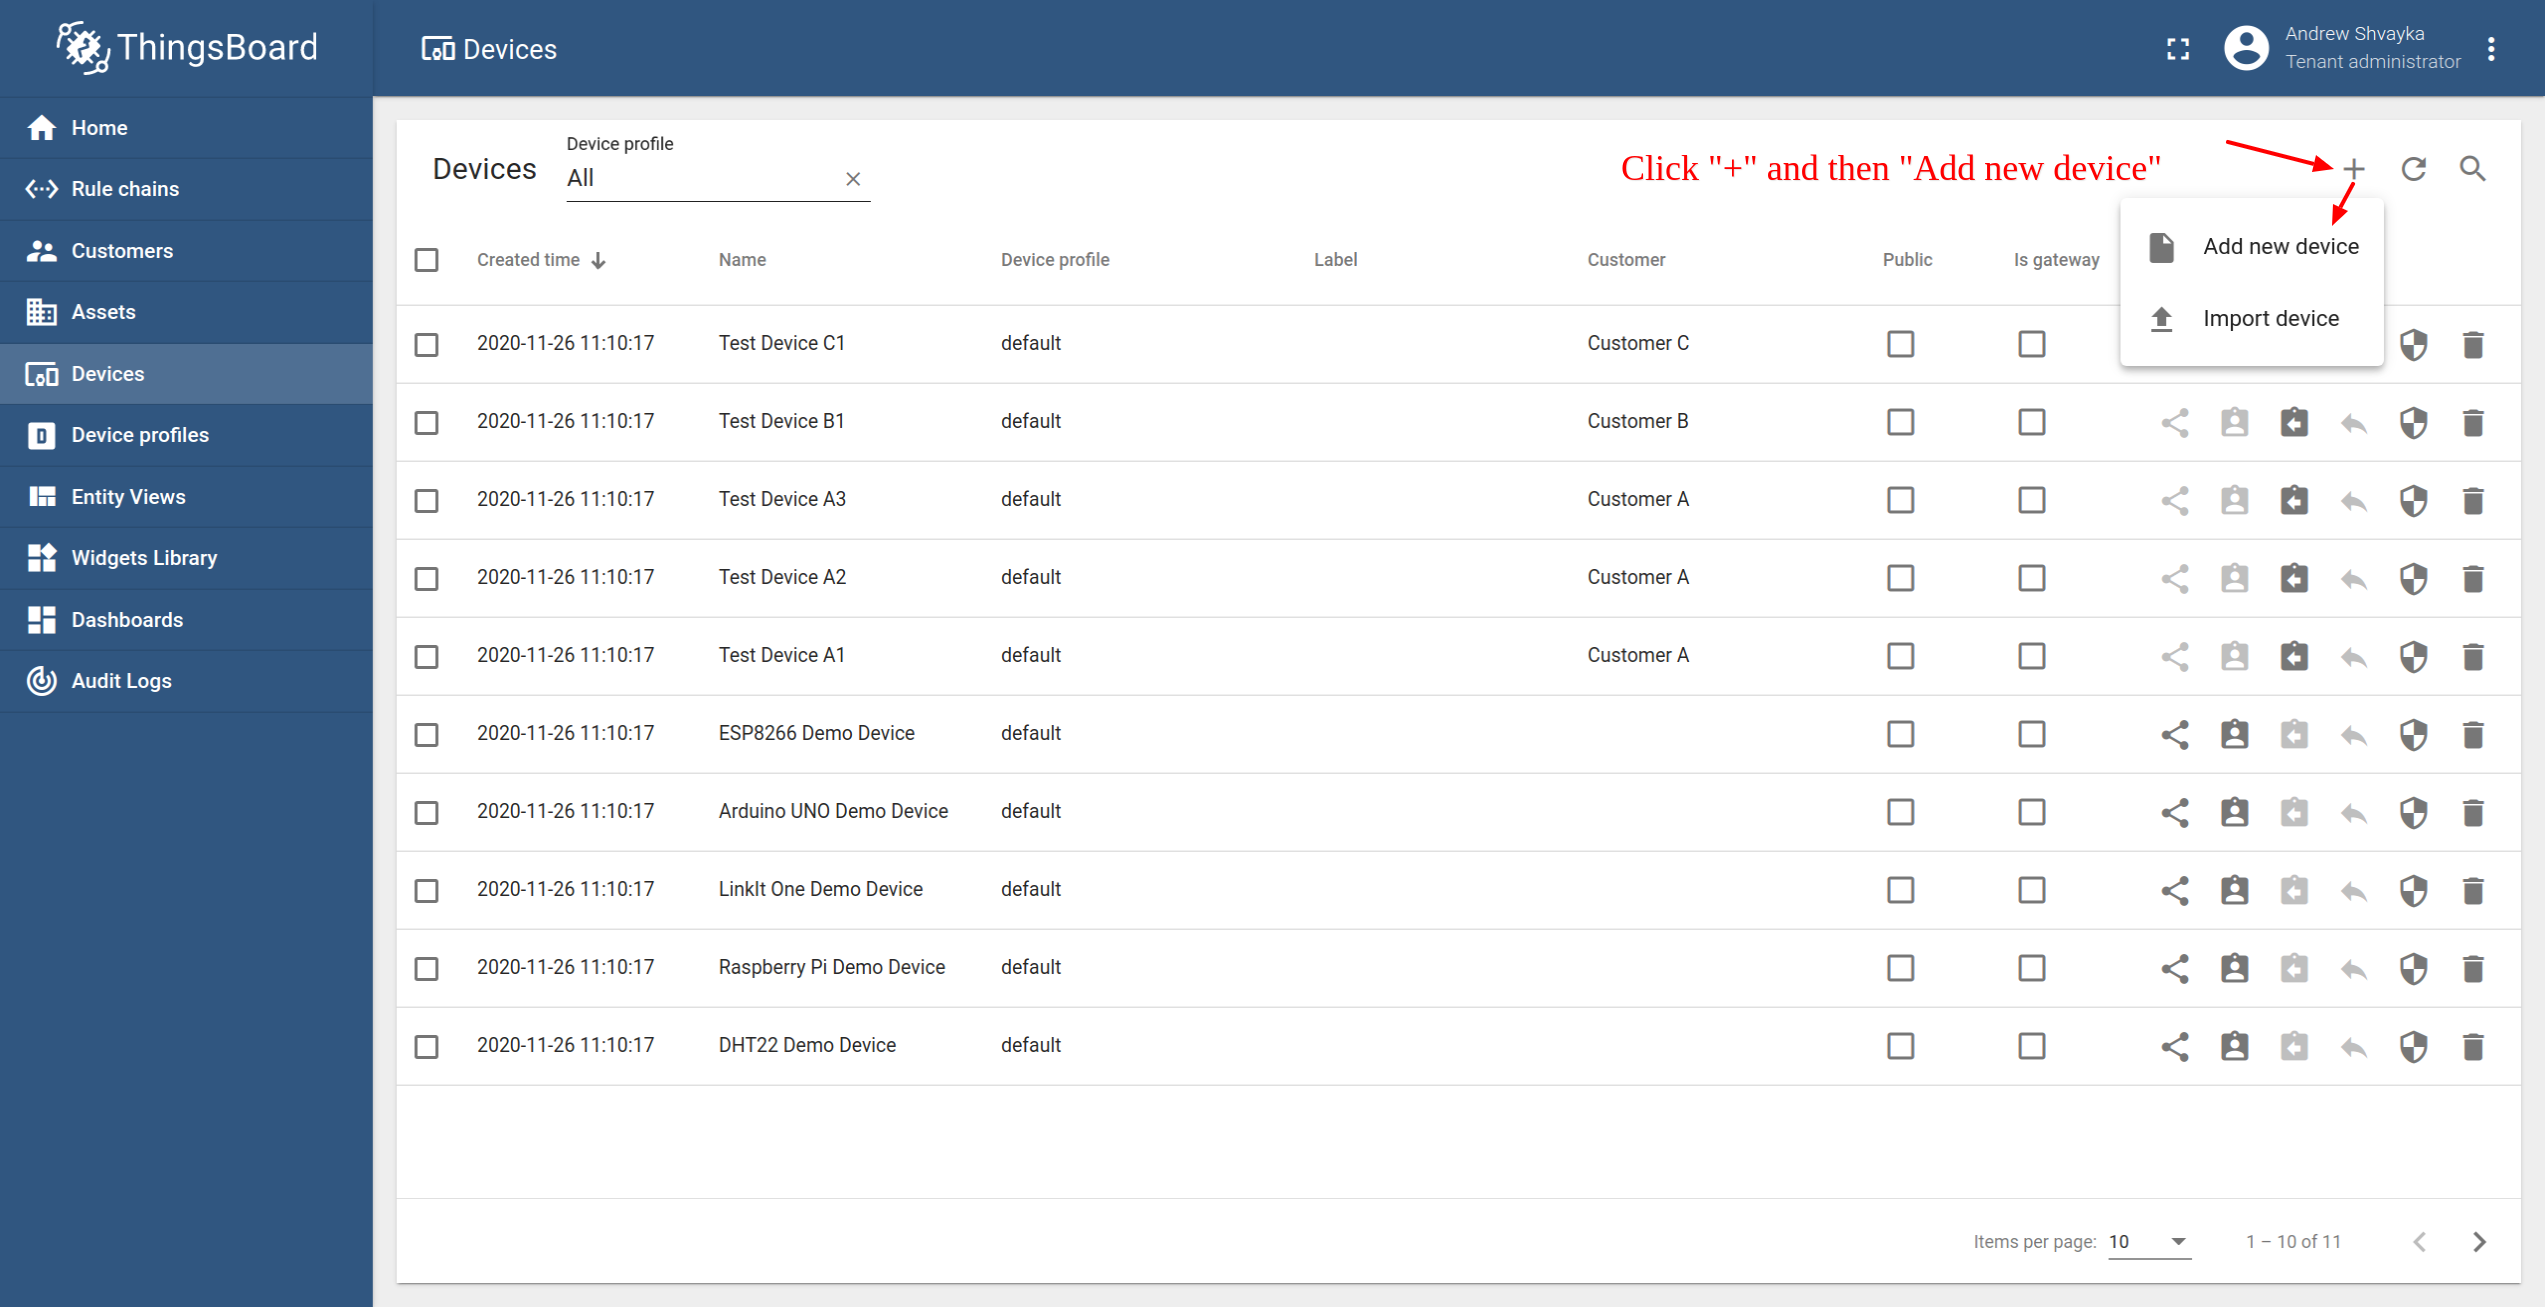
- Click on the "+" icon in the top right corner of the table and then select "Add new device".
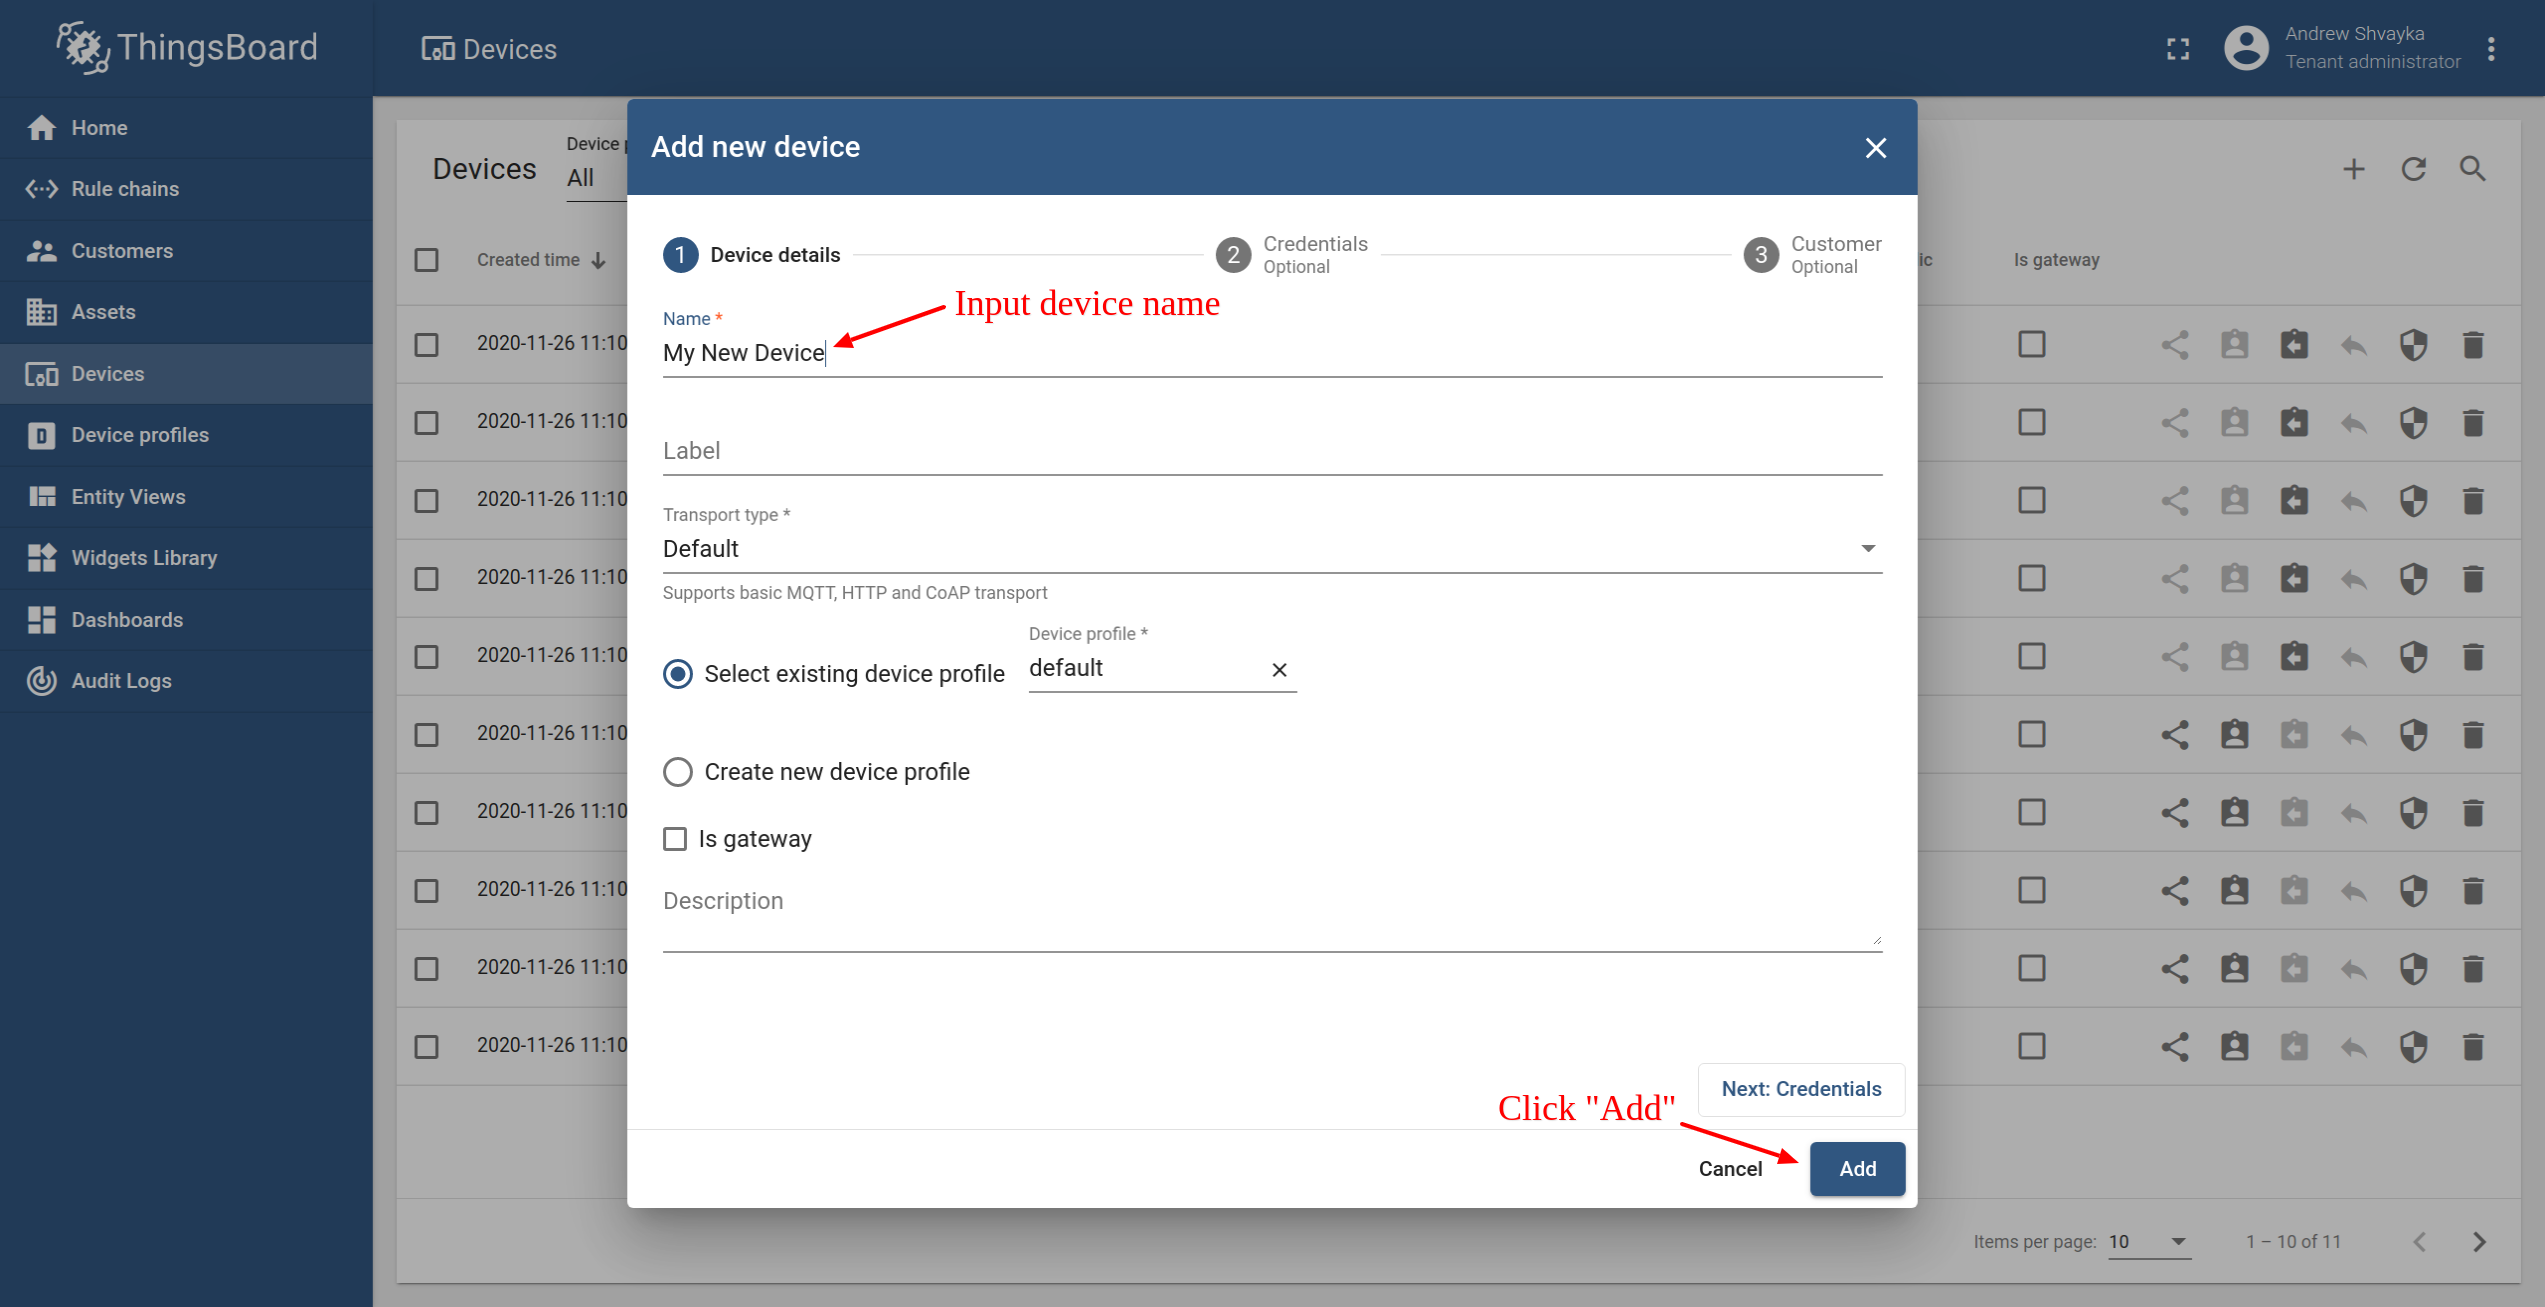
- Input device name. For example, "My New Device". No other changes required at this time. Click "Add" to add the device.
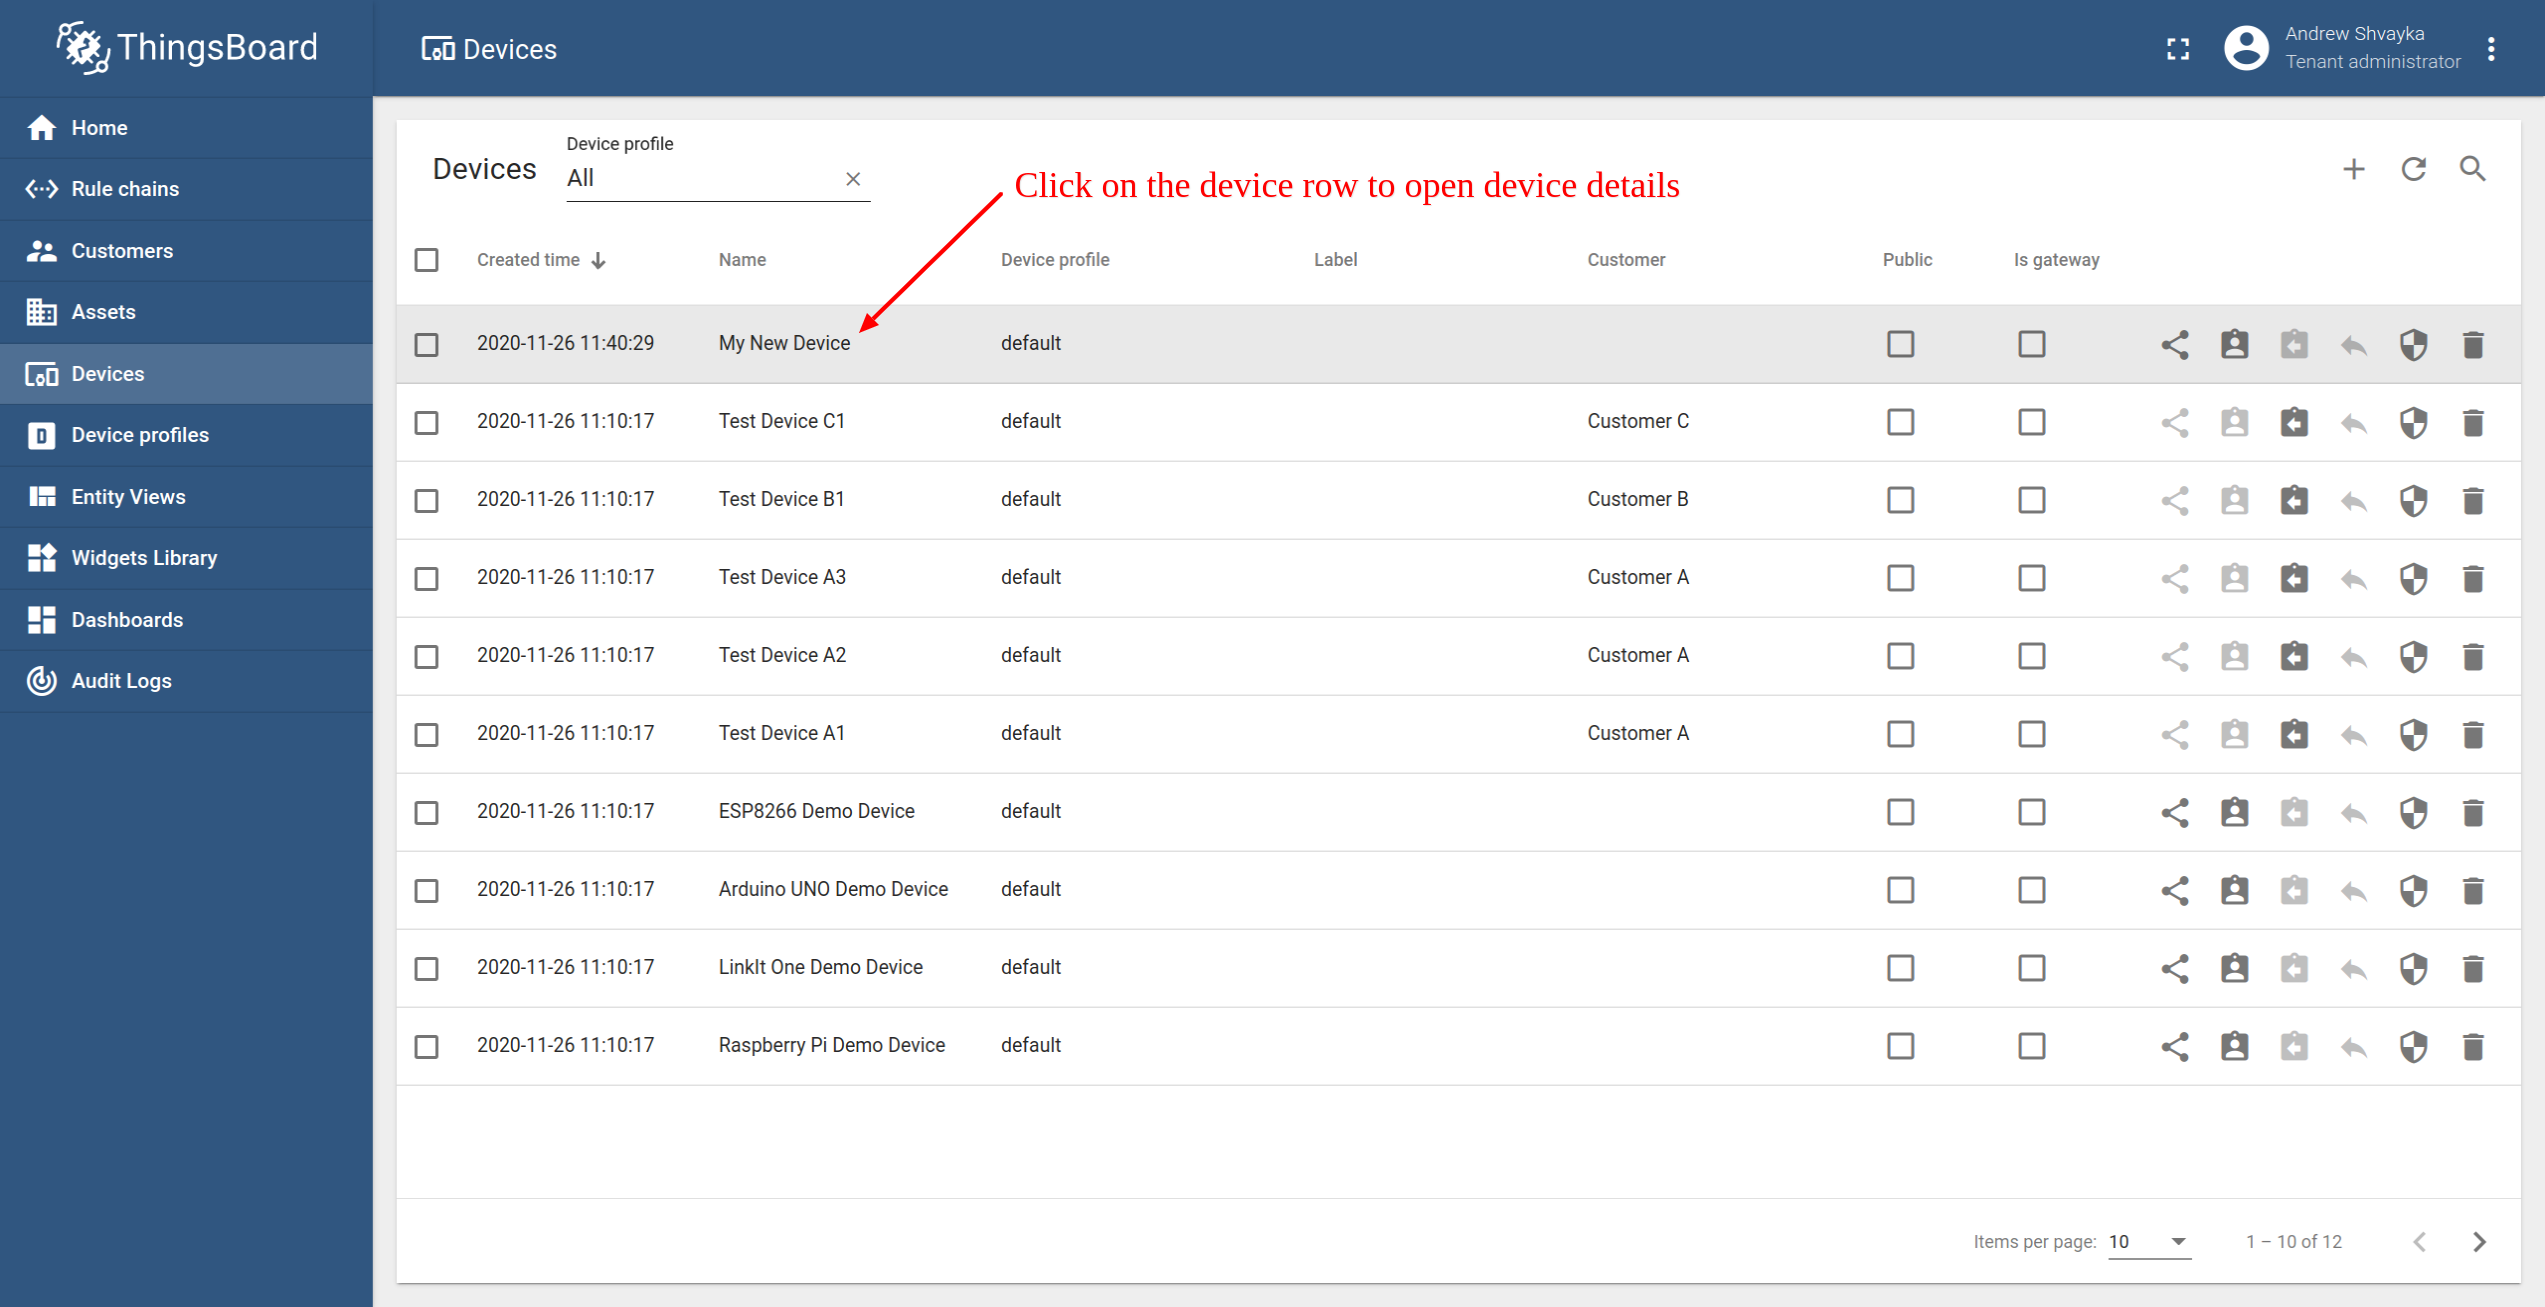
- Now your device should be listed first, since the table sort devices using the time of the creation by default.

Você também pode usar:
- Bulk provisioning to provision multiple devices from a CSV file using UI;
- Device provisioning to allow device firmware to automatically provision the device, so you don’t need to configure each device manually;
- REST API to provision devices and other entities programmatically;
Passo 2: Conectar dispositivo
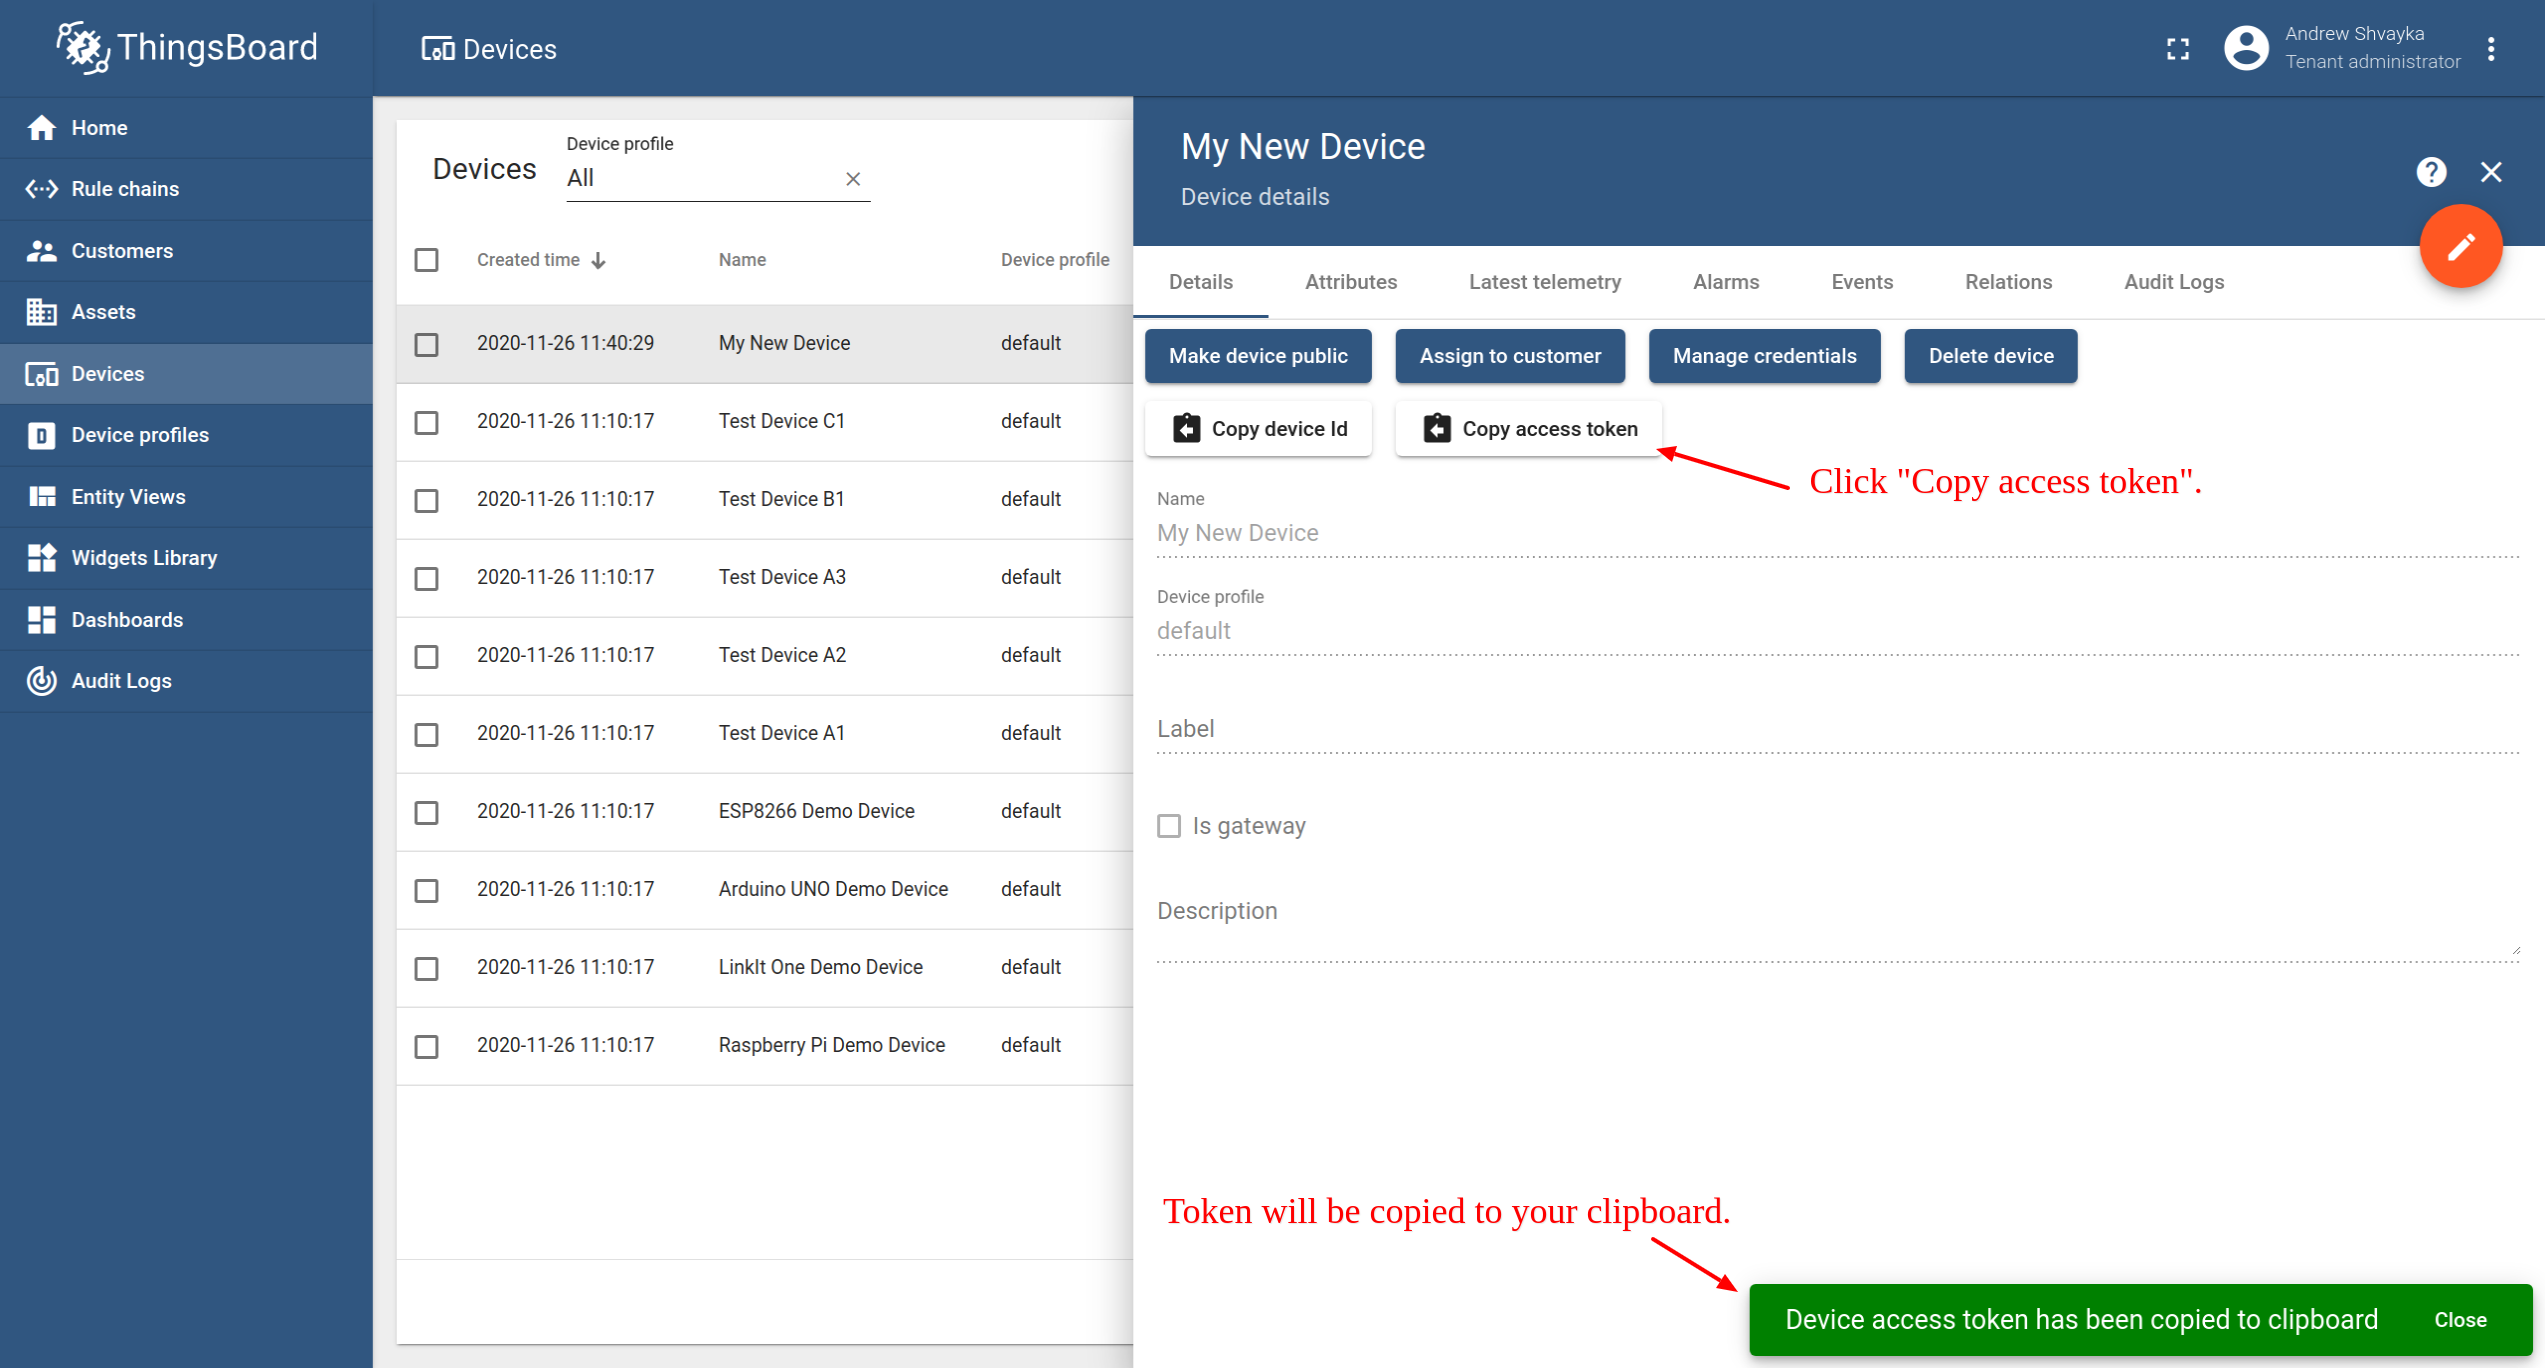
To connect the device you need to get the device credentials first. ThingsBoard supports various device credentials. We recommend using default auto-generated credentials which is access token for this guide.
- Click on the device row in the table to open device details
- Clique em "Copiar token de acesso". O token será copiado para a sua área de transferência. Salve-o em um lugar seguro.
Now you are ready to publish telemetry data on behalf of your device. We will use simple commands to publish data over HTTP or MQTT in this example.
|
Instale o cURL para Ubuntu: Instale o cURL para macOS: Instale o cURL para Windows: Starting Windows 10 b17063, cURL is available by default. More info is available in this MSDB blog post. Se você estiver usando uma versão mais antiga do sistema operacional Windows, você pode encontrar Guias de Instalação aqui. Este comando funciona para Windows, Ubuntu e macOS, assumindo que a ferramenta cURL já esteja instalada. Substitua $ HOST_NAME e $ ACCESS_TOKEN pelos valores correspondentes. For example, $HOST_NAME reference live demo server, access token is ABC123: Por exemplo, $HOST_NAME faz referência ao servidor RETINA, o token de acesso é ABC123:
|
|
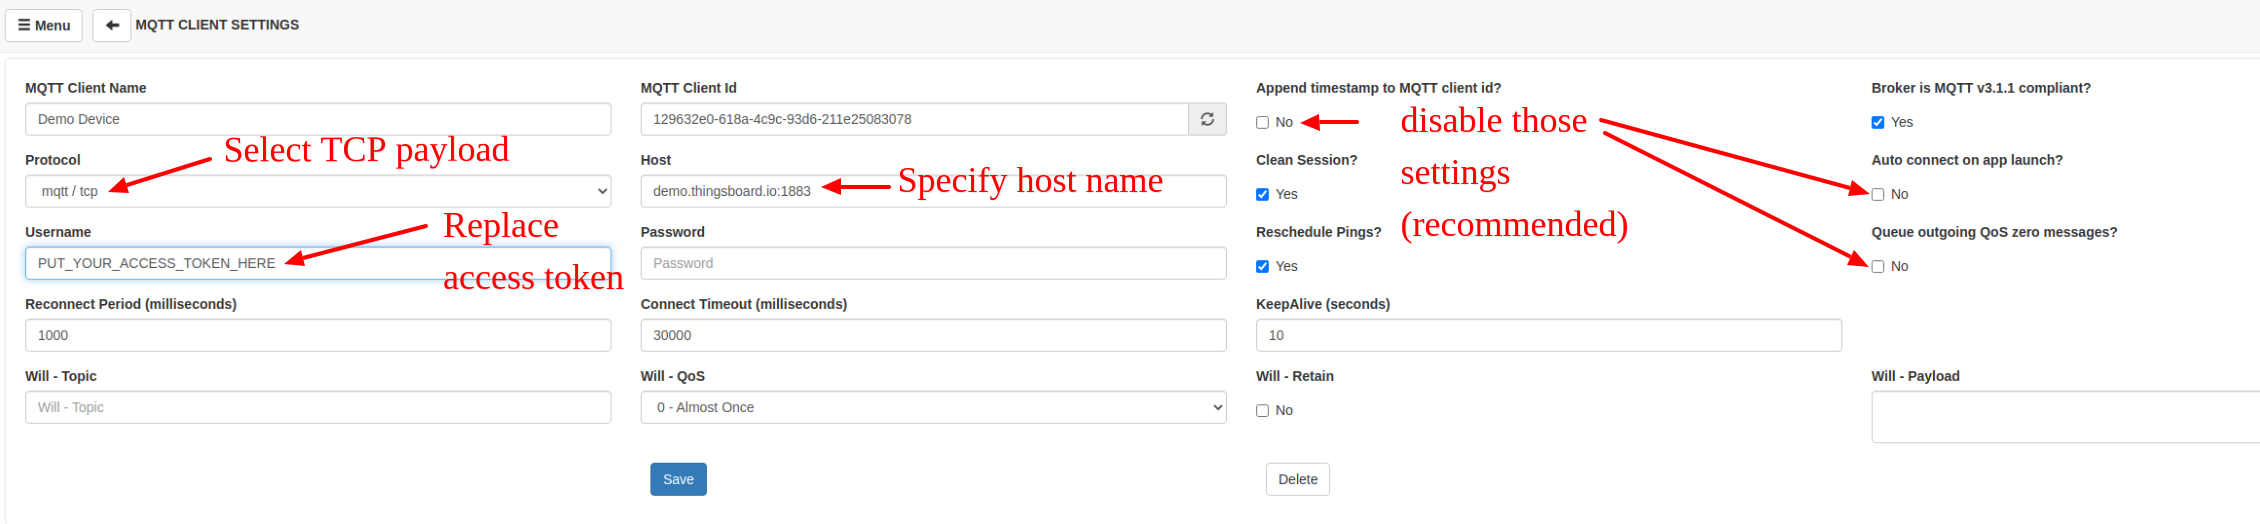
Instale o cliente MQTT para Ubuntu: Instale o cURL para macOS: Substitua $ HOST_NAME e $ ACCESS_TOKEN pelos valores correspondentes. For example, $HOST_NAME reference live demo server, access token is ABC123: Por exemplo, $HOST_NAME faz referência ao servidor RETINA, o token de acesso é ABC123: A saída bem-sucedida deve ser semelhante a esta: Nota: Você é capaz de usar credenciais MQTT básicas (combinação de id do cliente, nome de usuário e senha) e personalizar nomes de tópico e tipo de carga útil usando Perfil de dispositivo. Veja mais informações .
|
|
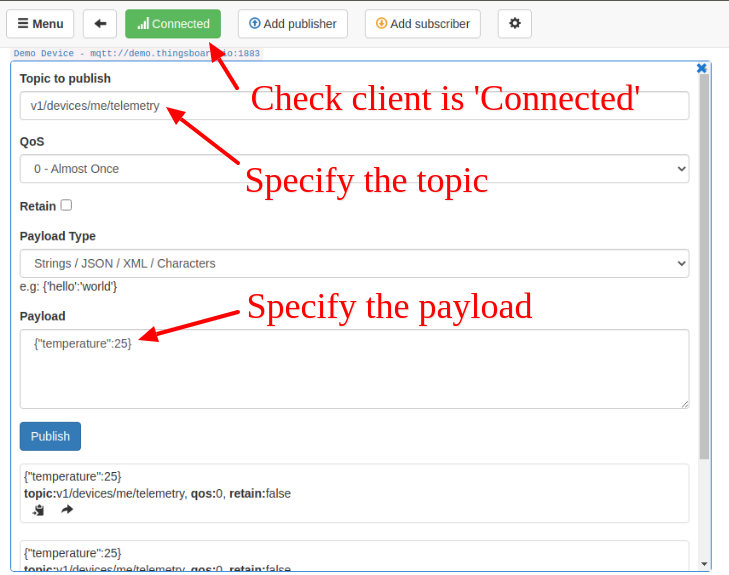
No Windows, instale o programa MQTTBox . Use as instruções listadas abaixo:
|
|
Install coap-cli. Assuming you have Node.js and NPM installed on your Windows/Linux/MacOS machine, execute the following command: Substitua $ HOST_NAME e $ ACCESS_TOKEN pelos valores correspondentes. For example, $HOST_NAME reference live demo server, access token is ABC123: Por exemplo, $HOST_NAME faz referência ao servidor RETINA, o token de acesso é ABC123:
|
|
ThingsBoard supports many other protocols. Please explore Tipos de conexões to find solution that matches your use case. Nota: Recomendamos começar a explorar os recursos da plataforma com dispositivos simulados conectados por MQTT.
|
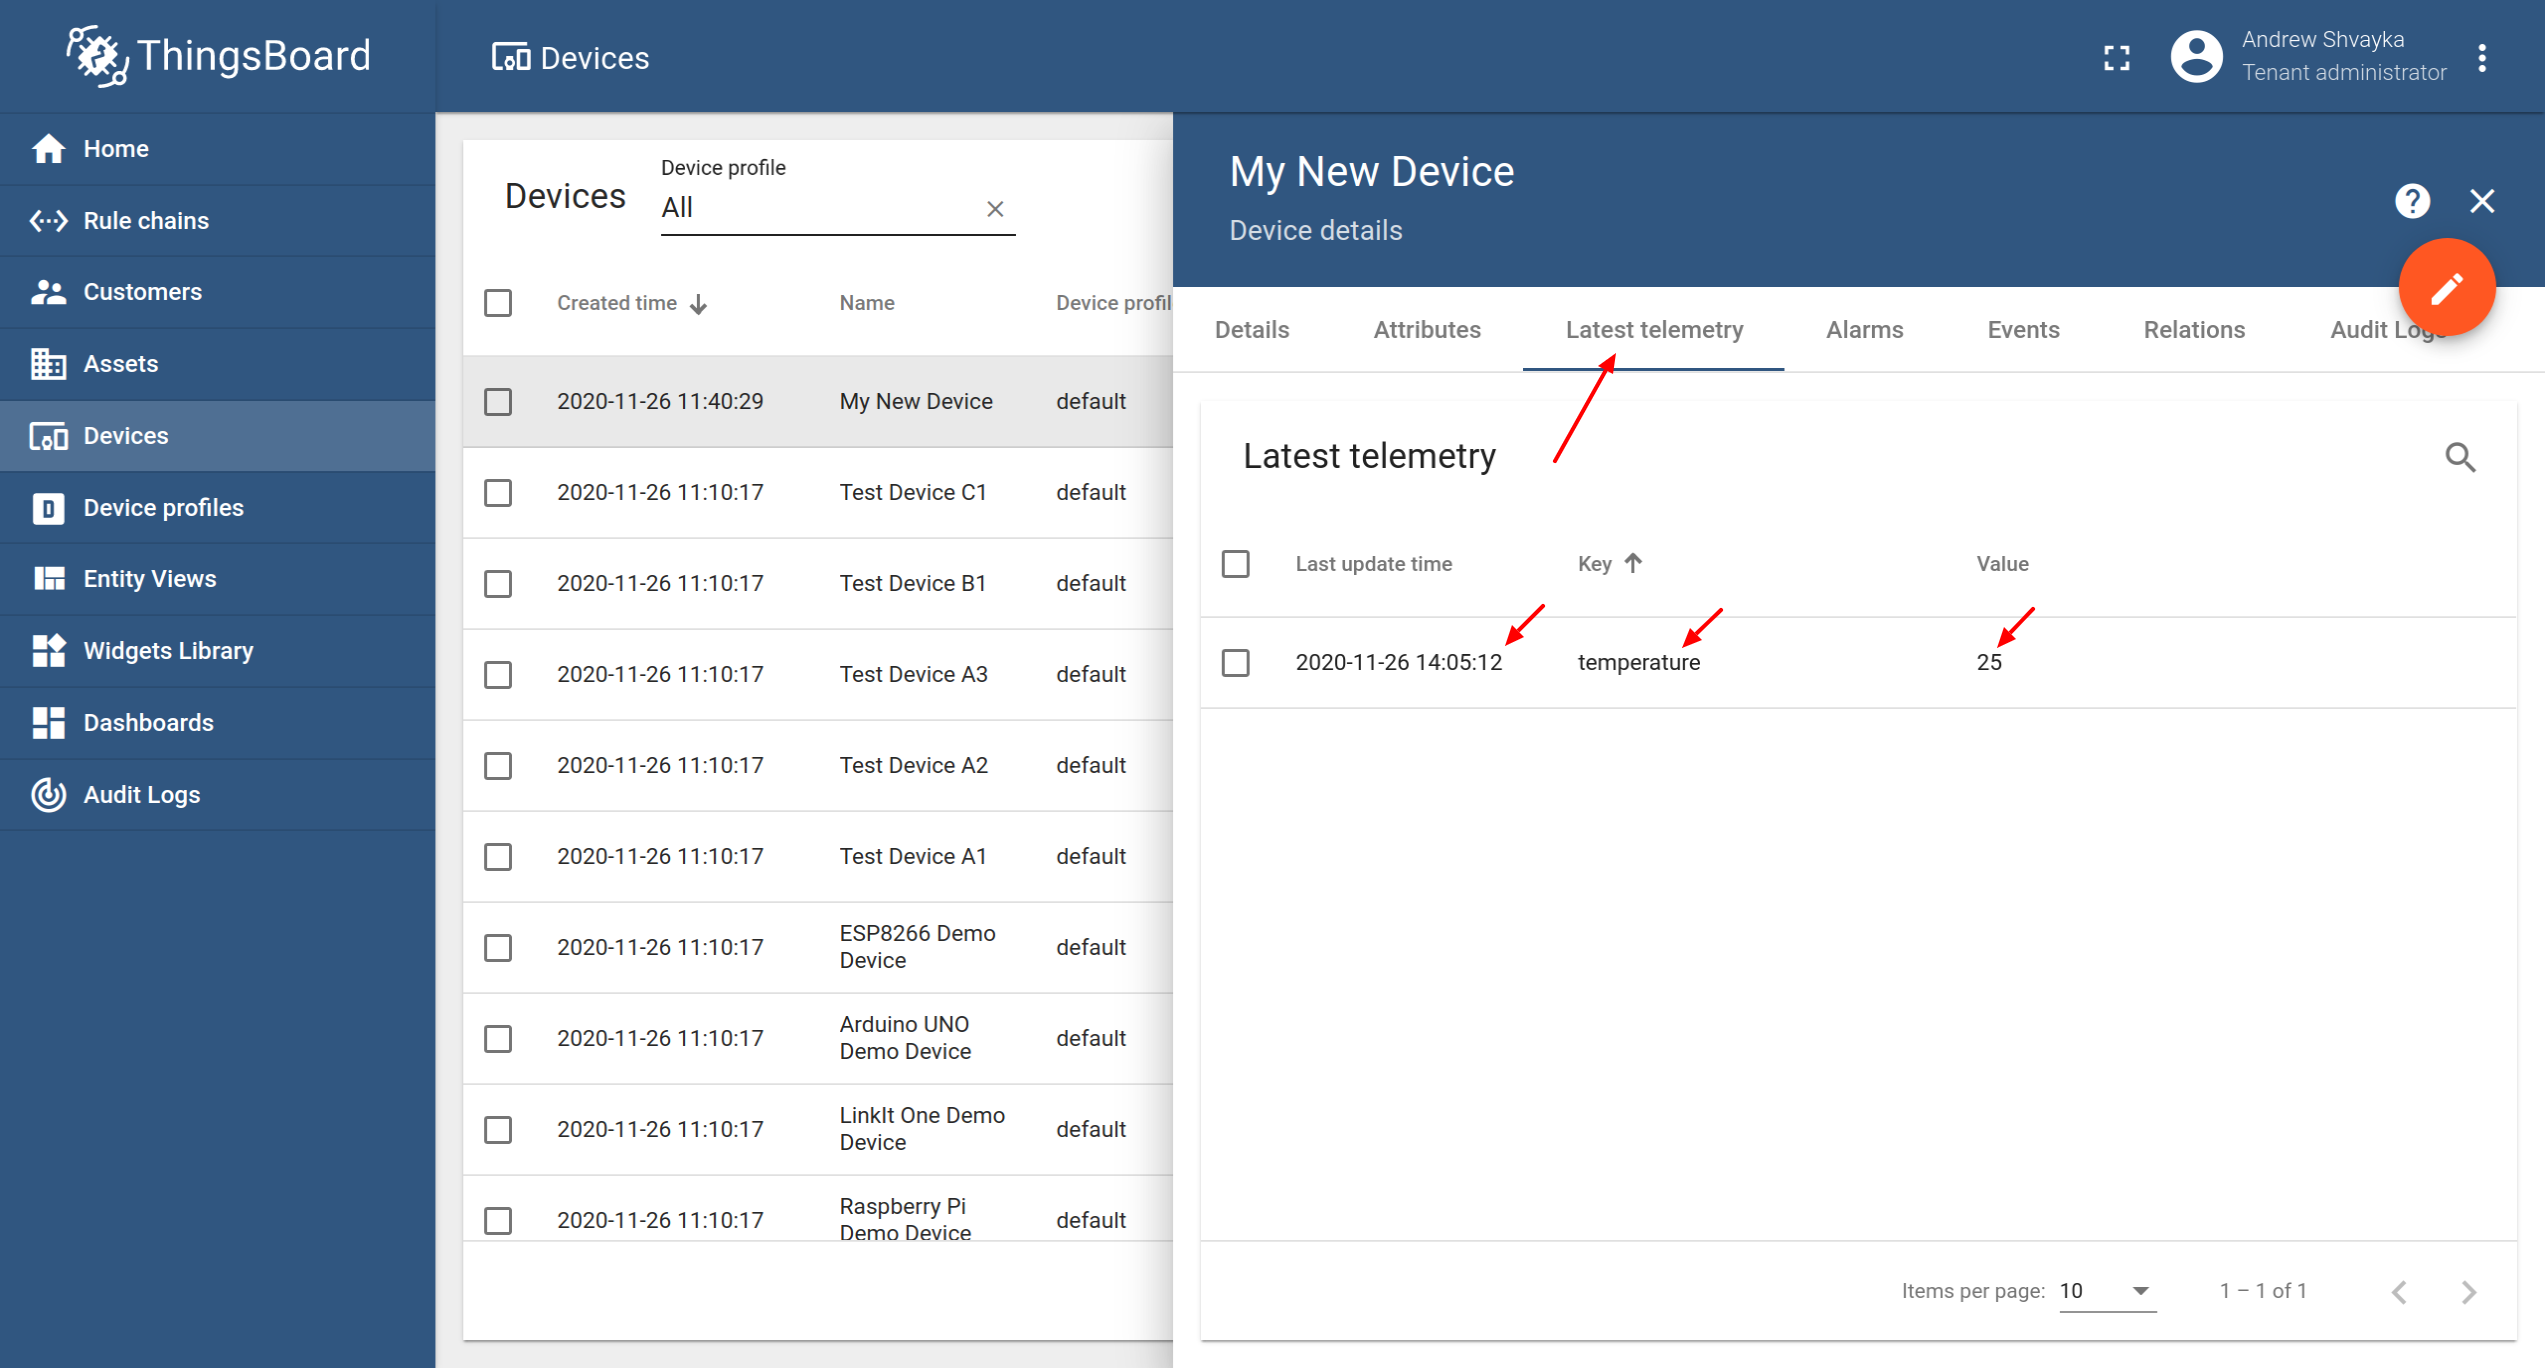
Depois de publicar com sucesso as leituras de "temperatura", você deve vê-las imediatamente na guia Telemetria do dispositivo:
- Click on the device row in the table to open device details
- Navegue até a guia telemetria.
Passo 3: Criar dashboard
We will create a dashboard and add the most popular widgets. See the instructions below.
Step 3.1 Create Empty Dashboard
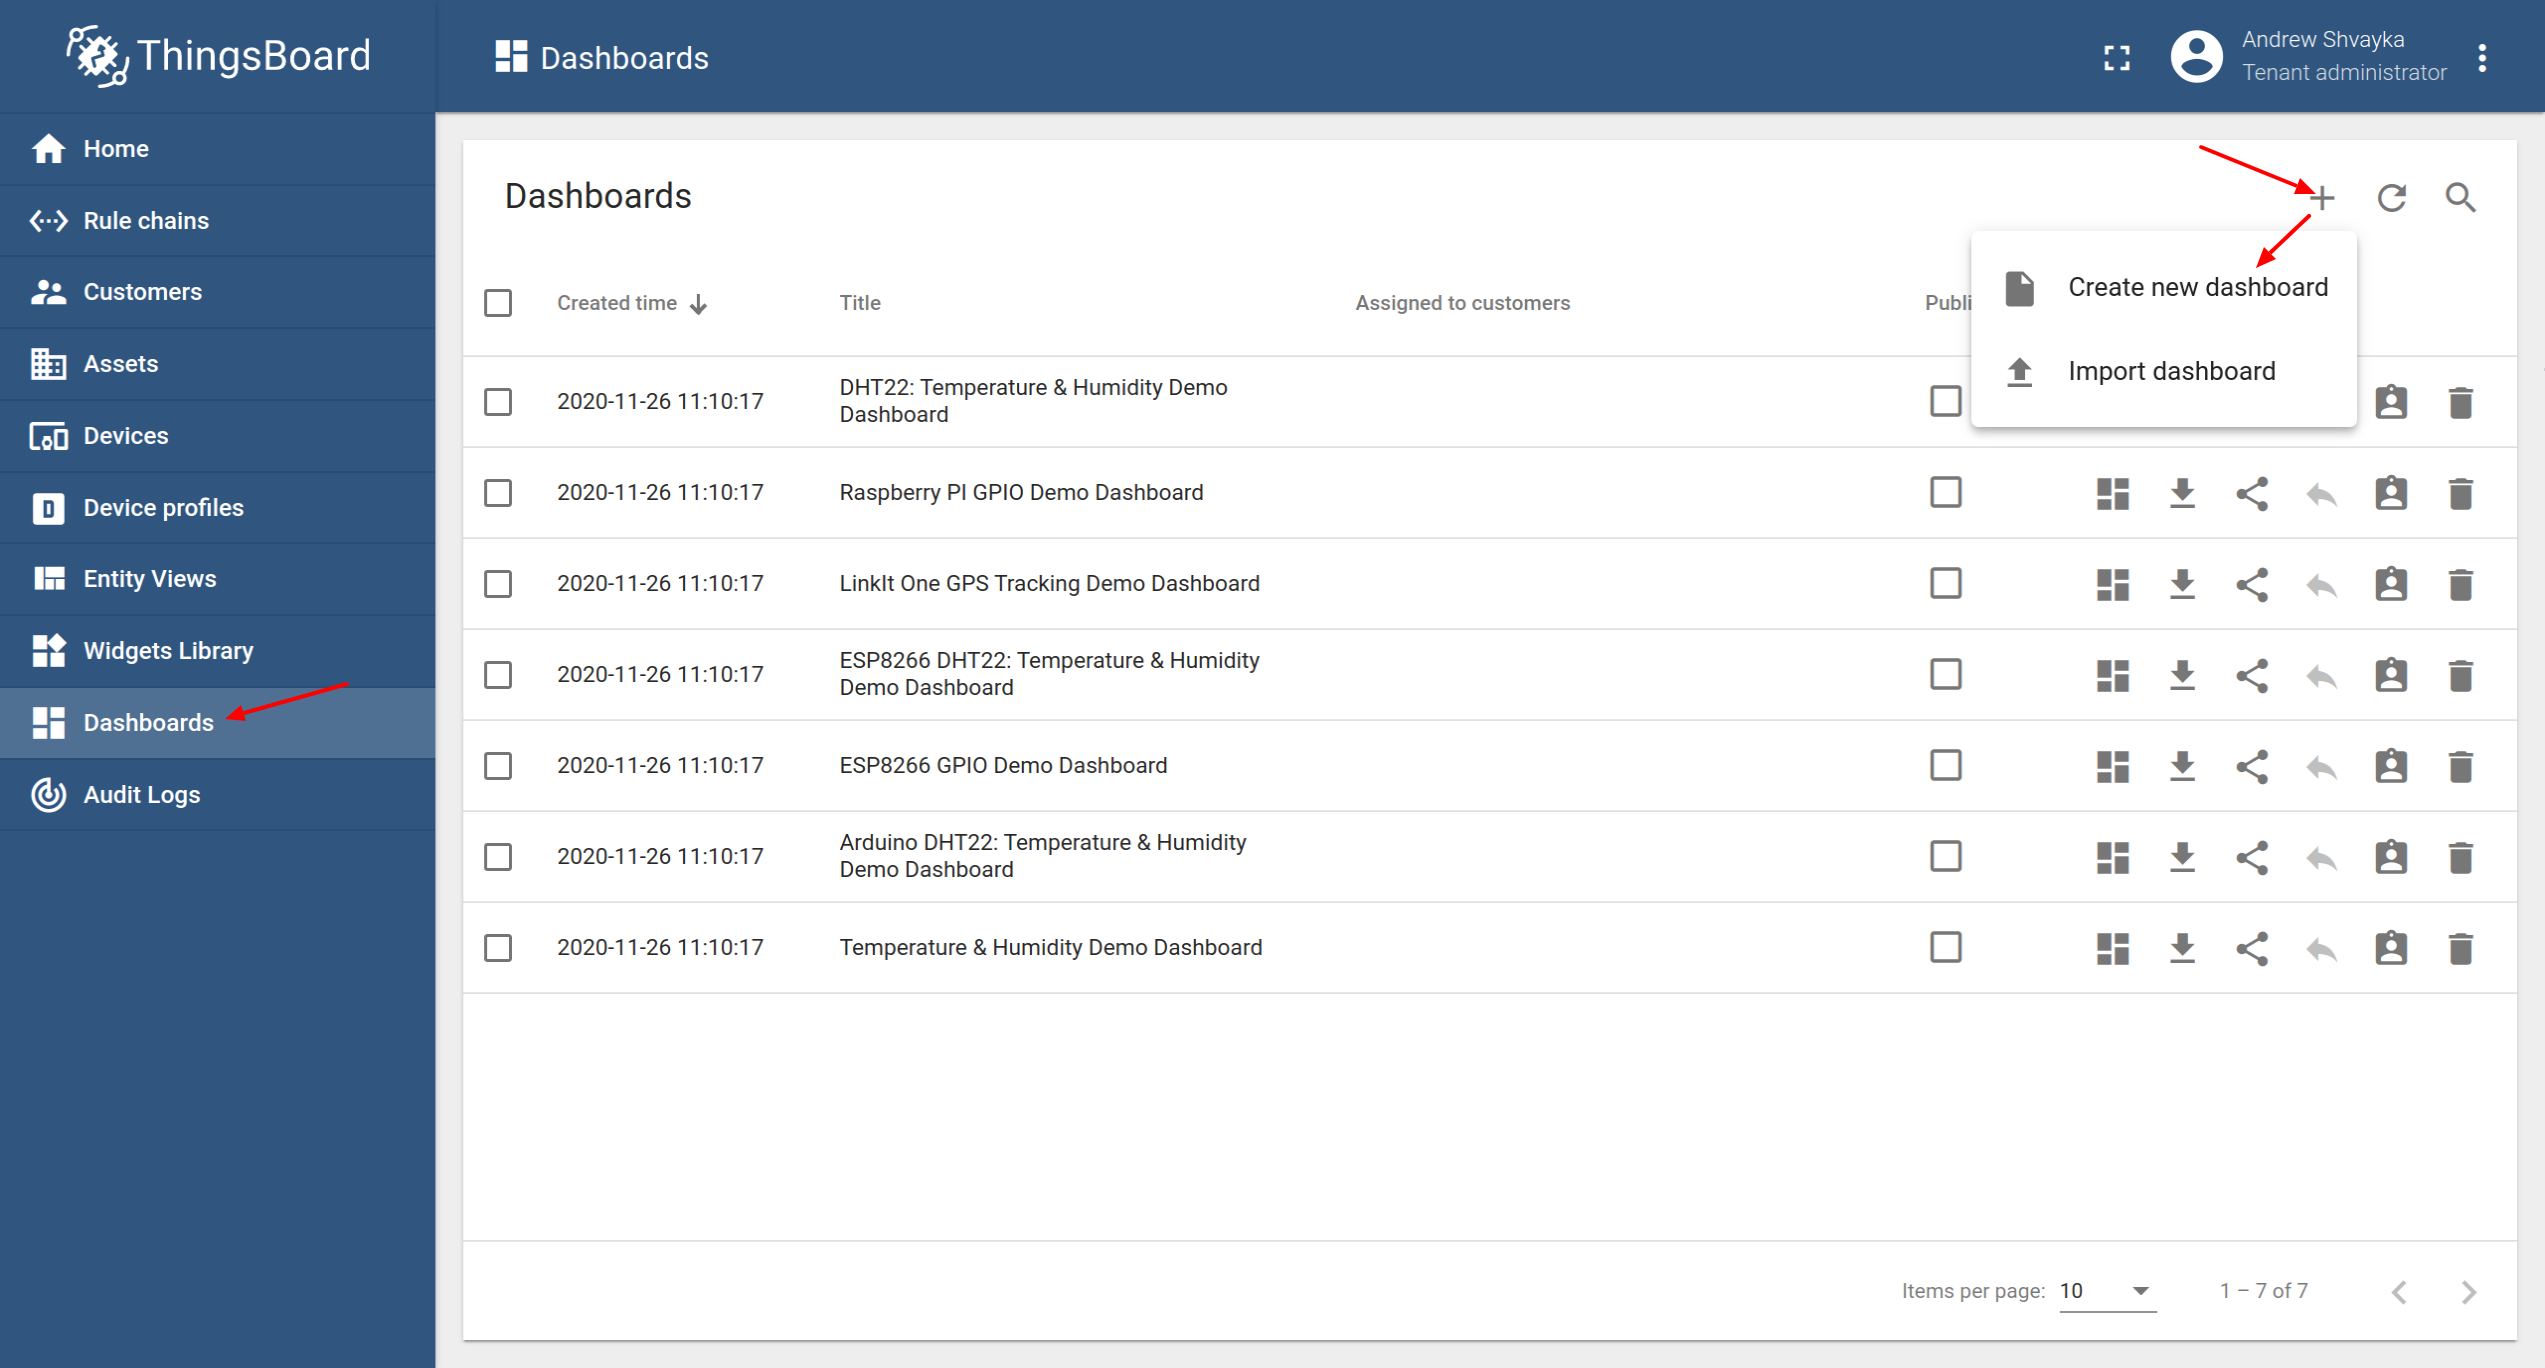
- Open the Dashboards page. Click on the "+" icon in the top right corner. Select "Create new dashboard".
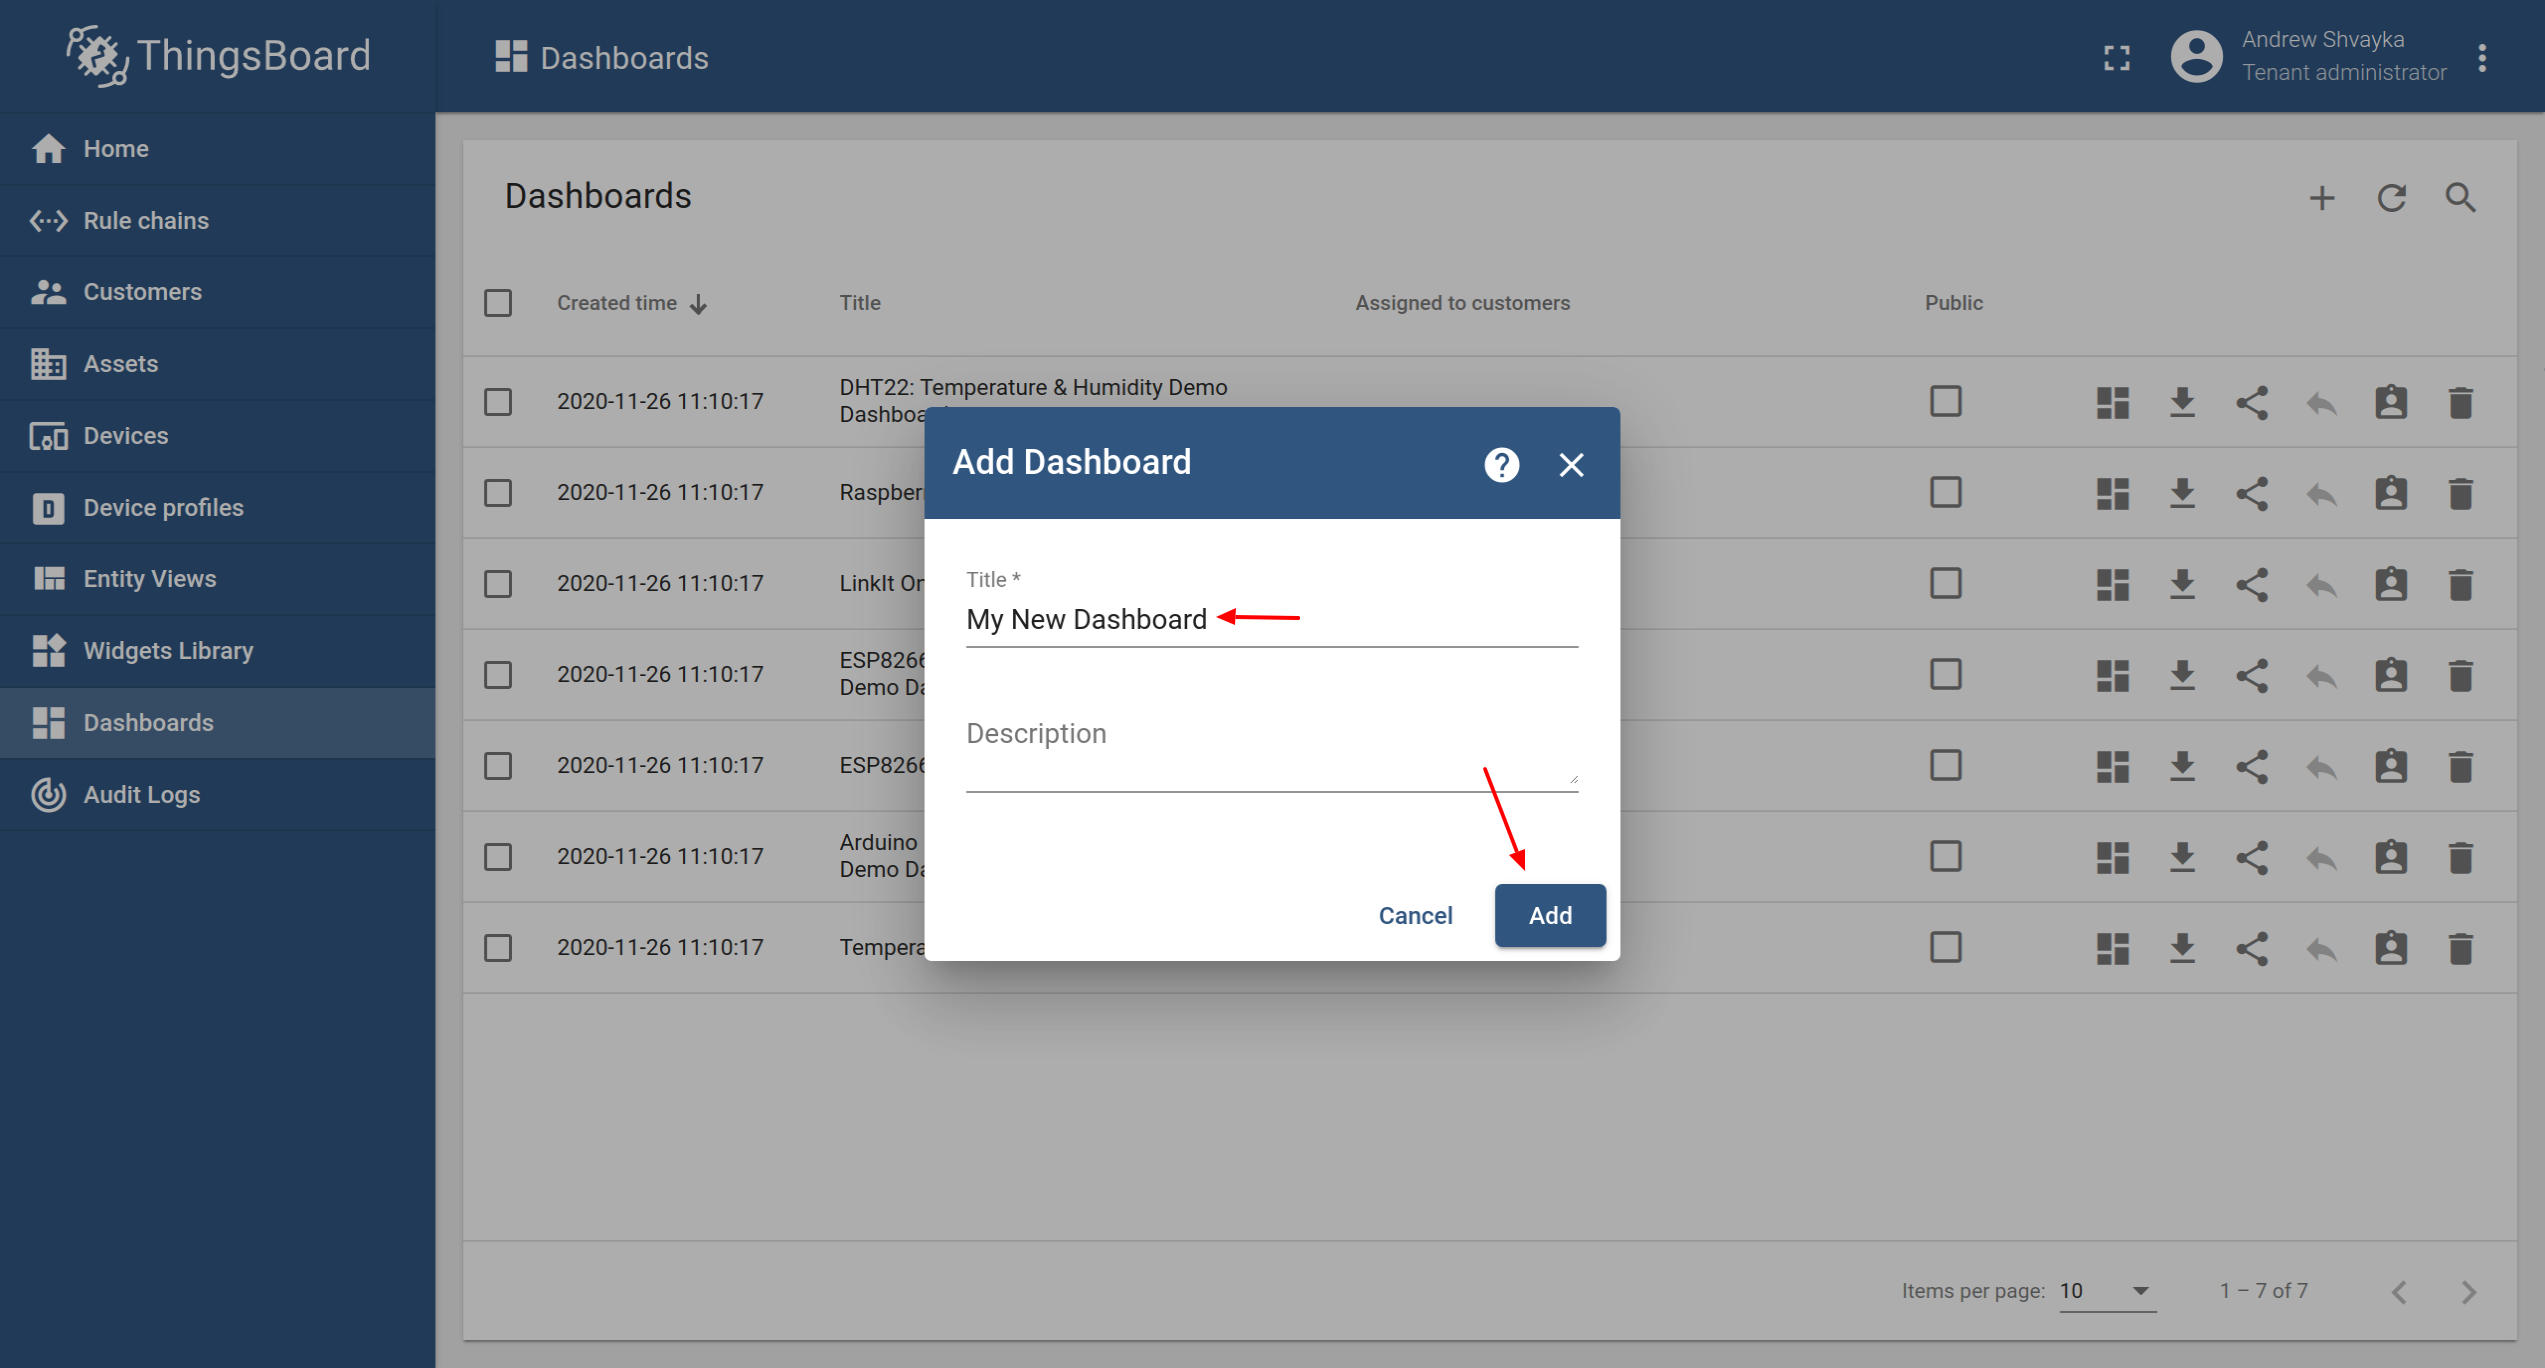
- Insira o nome do painel. Por exemplo, "Meu novo painel". Clique em "Adicionar" para adicionar o painel.
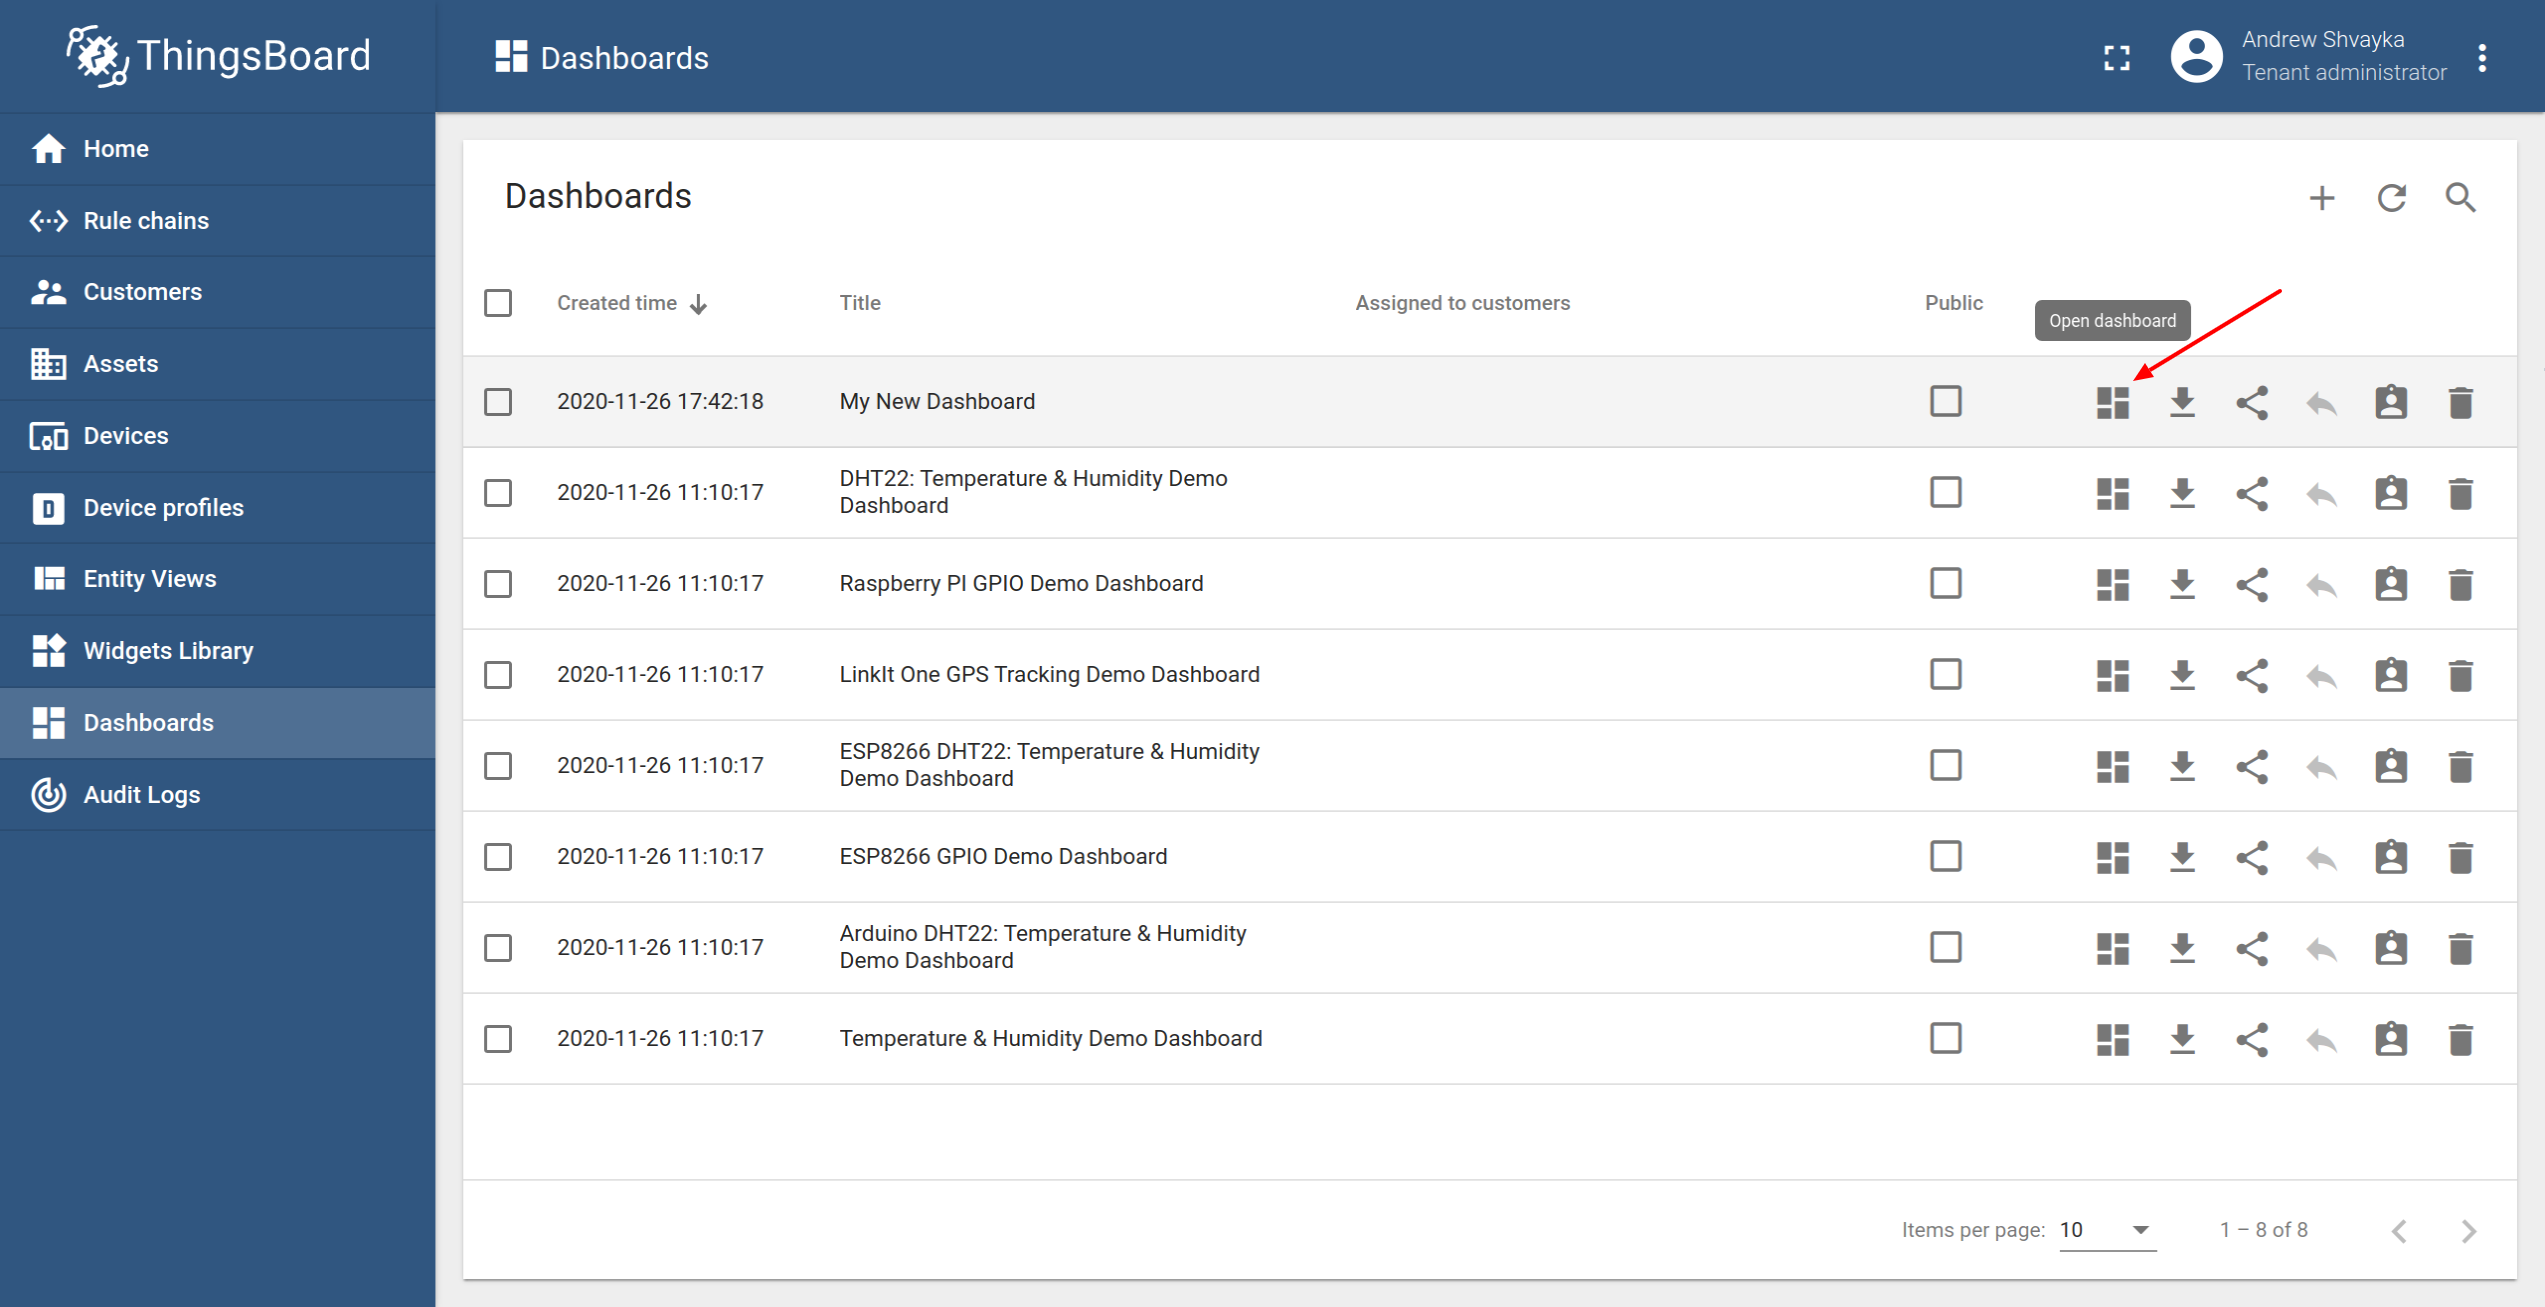
- Agora seu painel deve ser listado primeiro, já que a tabela classifica os painéis usando o tempo de criação por padrão. Clique no ícone "Abrir painel".
Passo 3.2 Adicionar um alias de entidade
Alias is a reference to a single entity or group of entities that are used in the widgets. Alias may be static or dynamic. For simplicity, we will use “Single entity” alias references the one and only entity (“My New Device” in our case). It is possible to configure an alias that references multiple devices. For example, devices of a certain type or related to a certain asset. You may learn more about different aliases aqui.
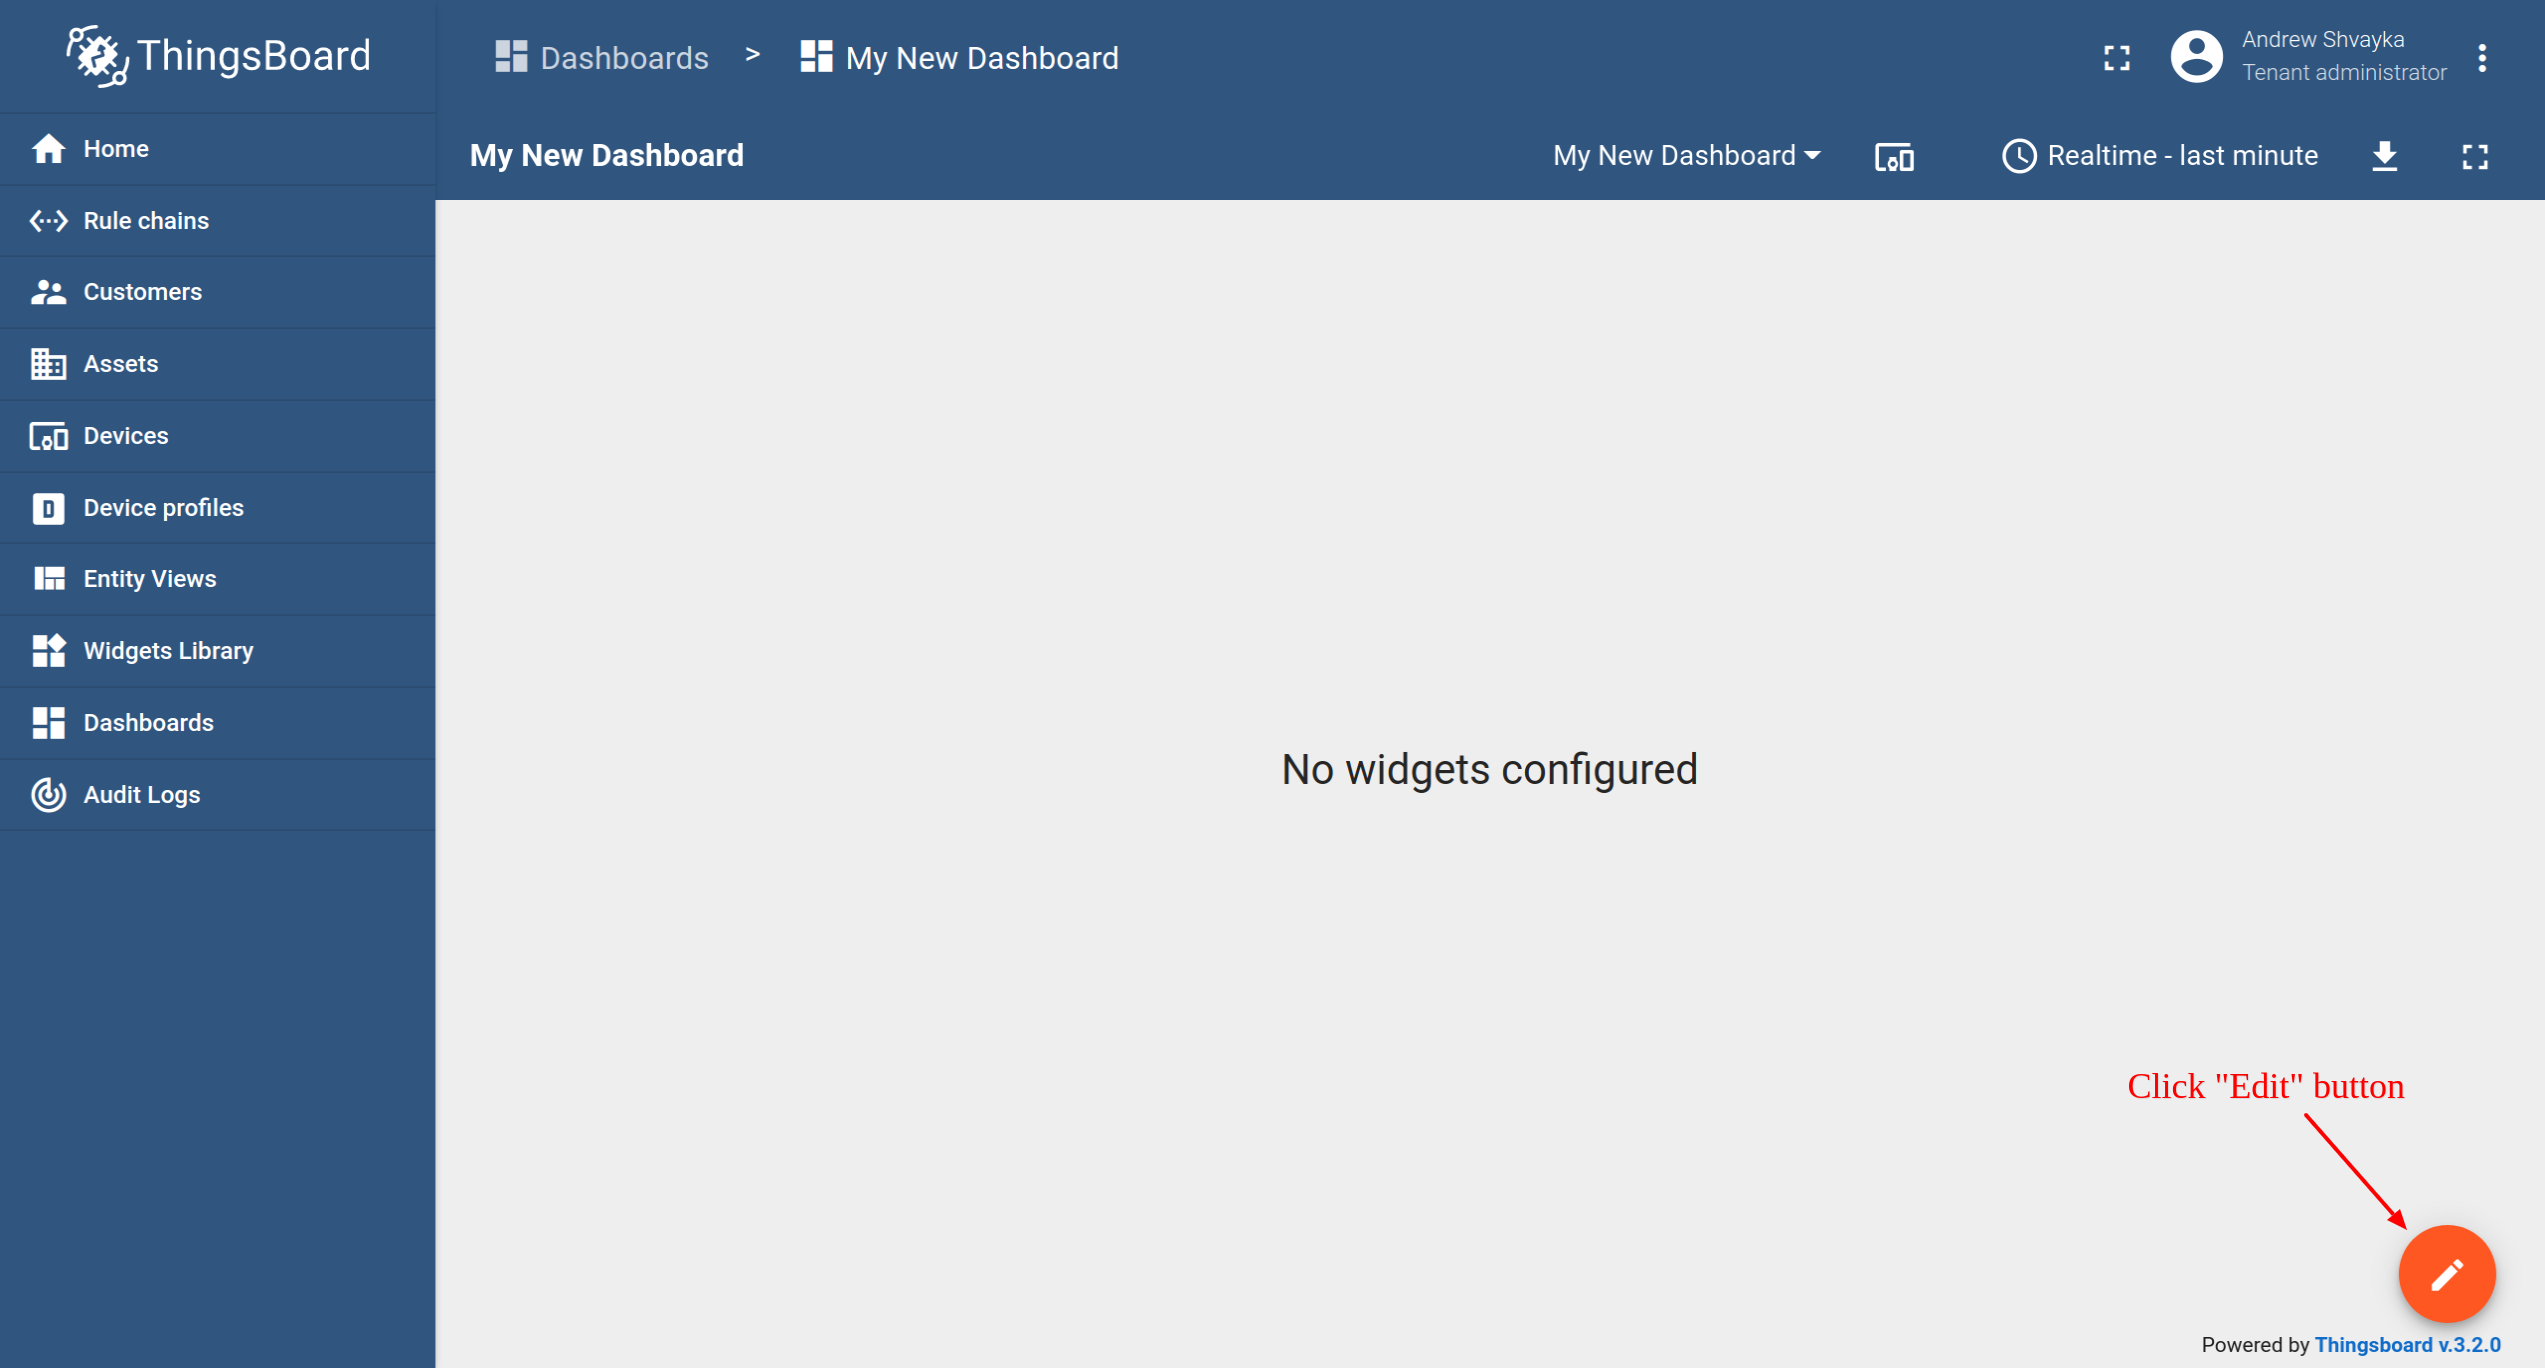
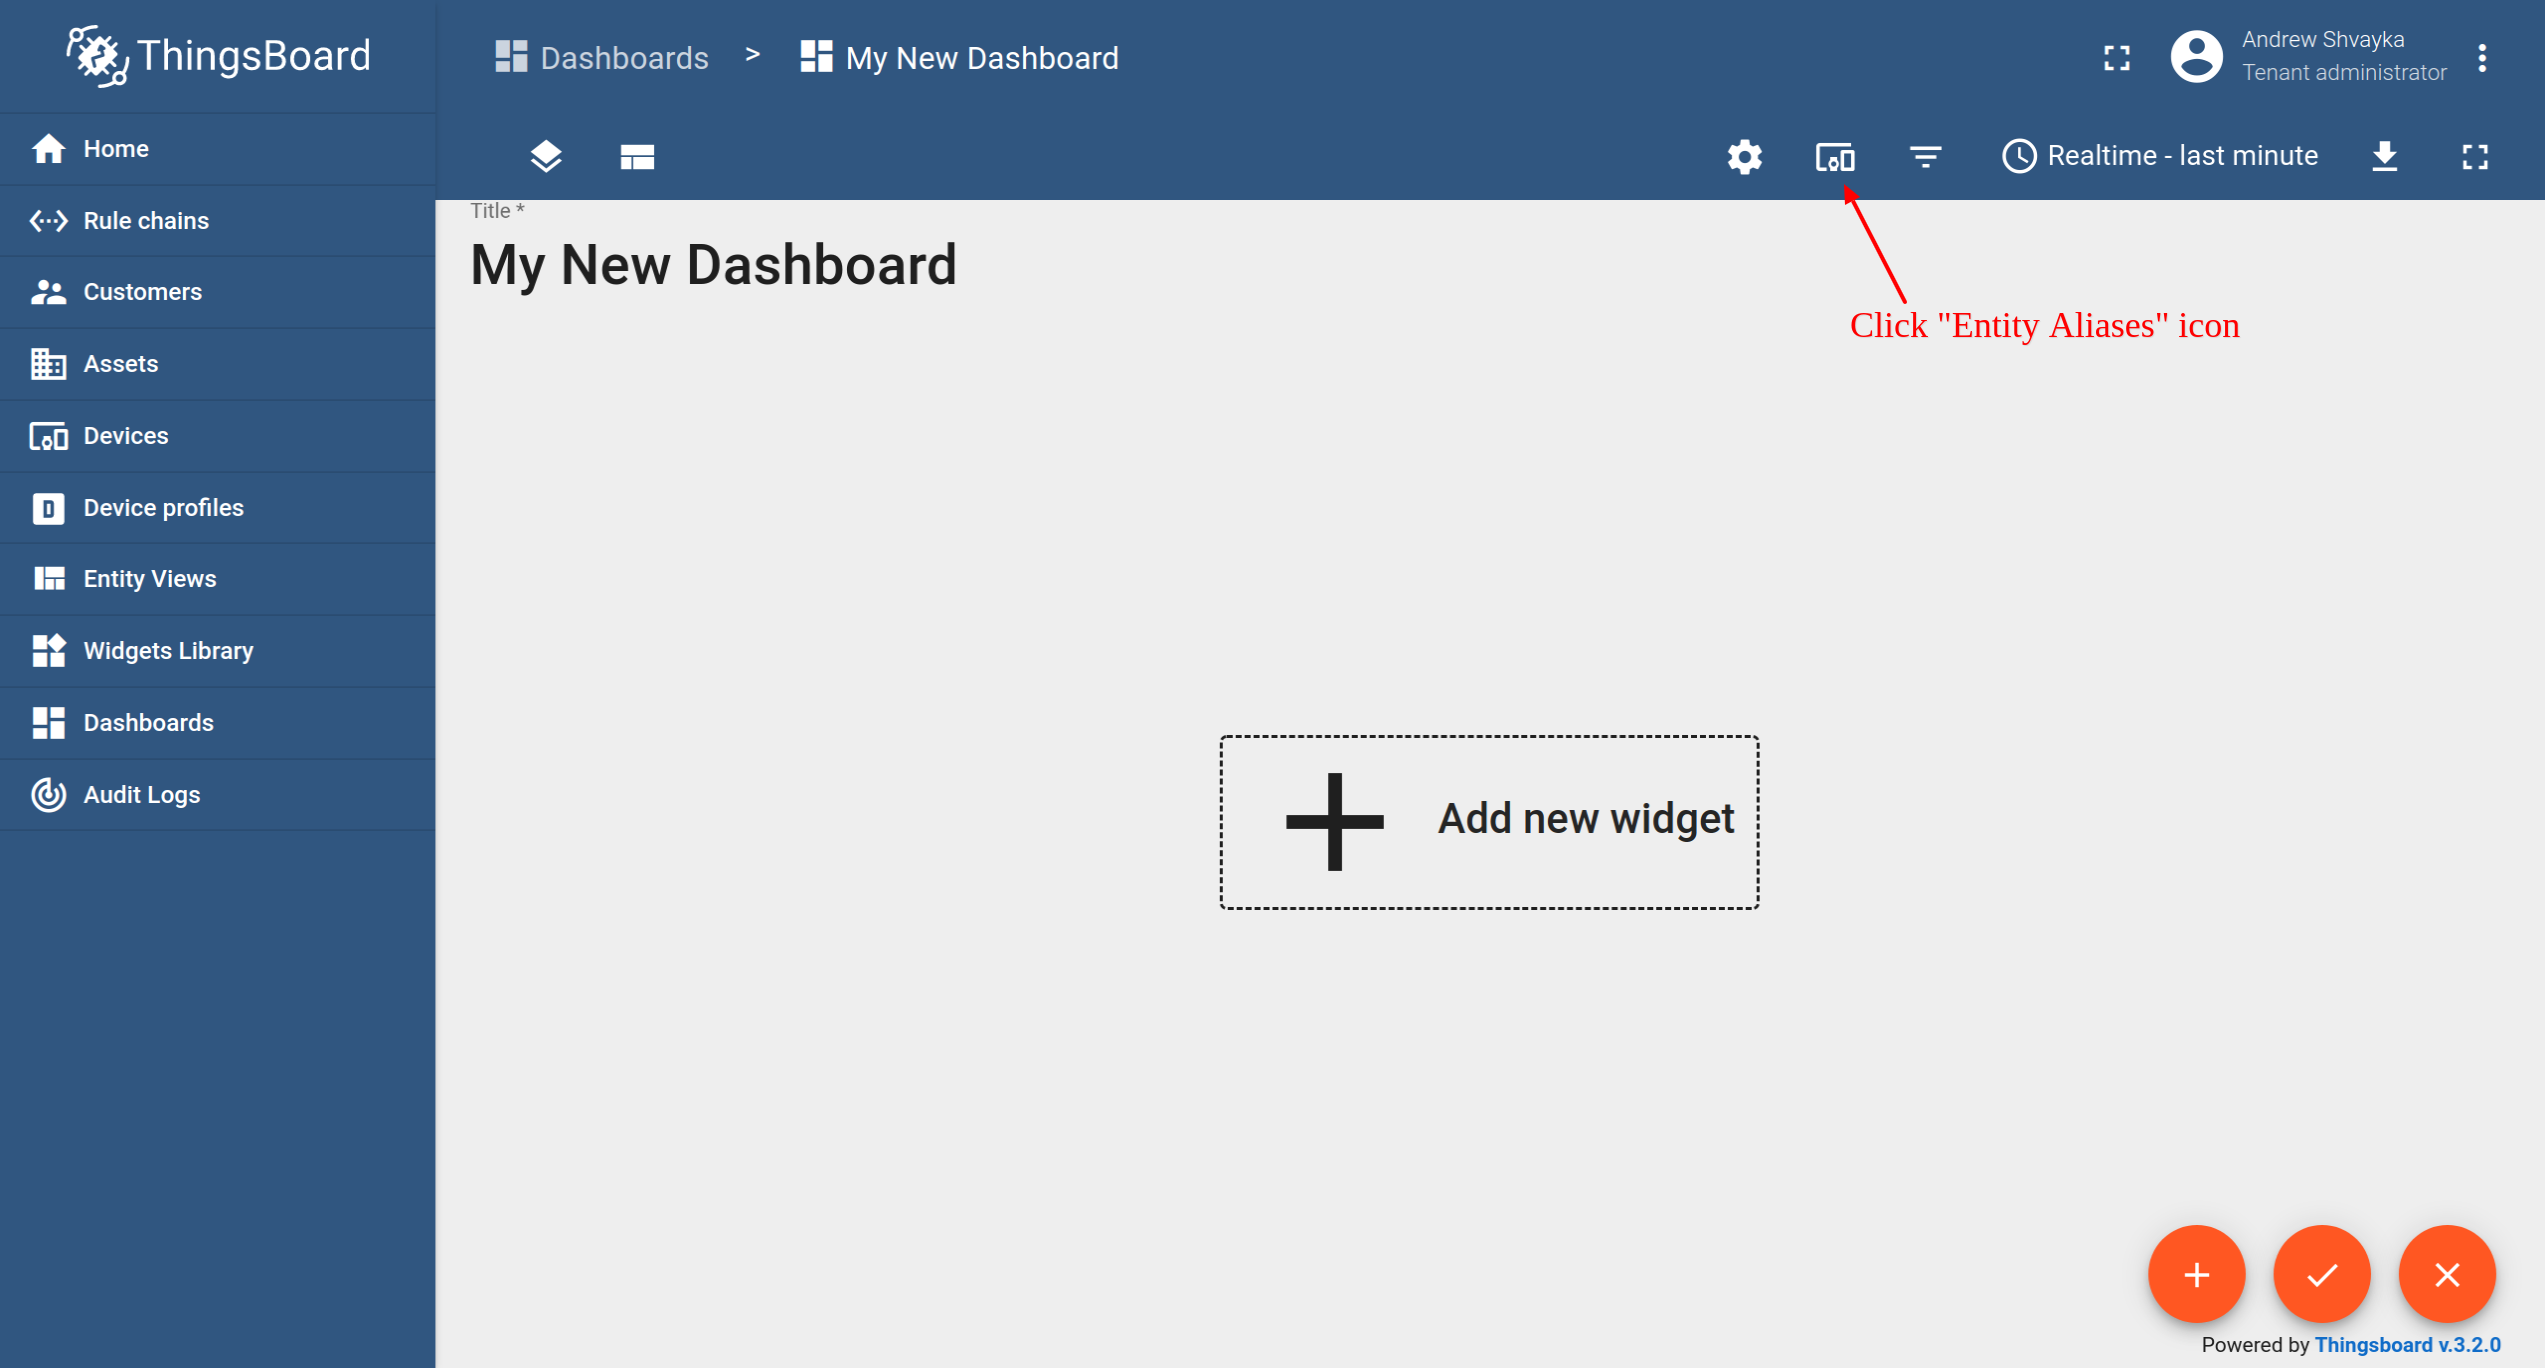
- Entrar no modo de edição. Clique no botão de lápis no canto inferior direito.
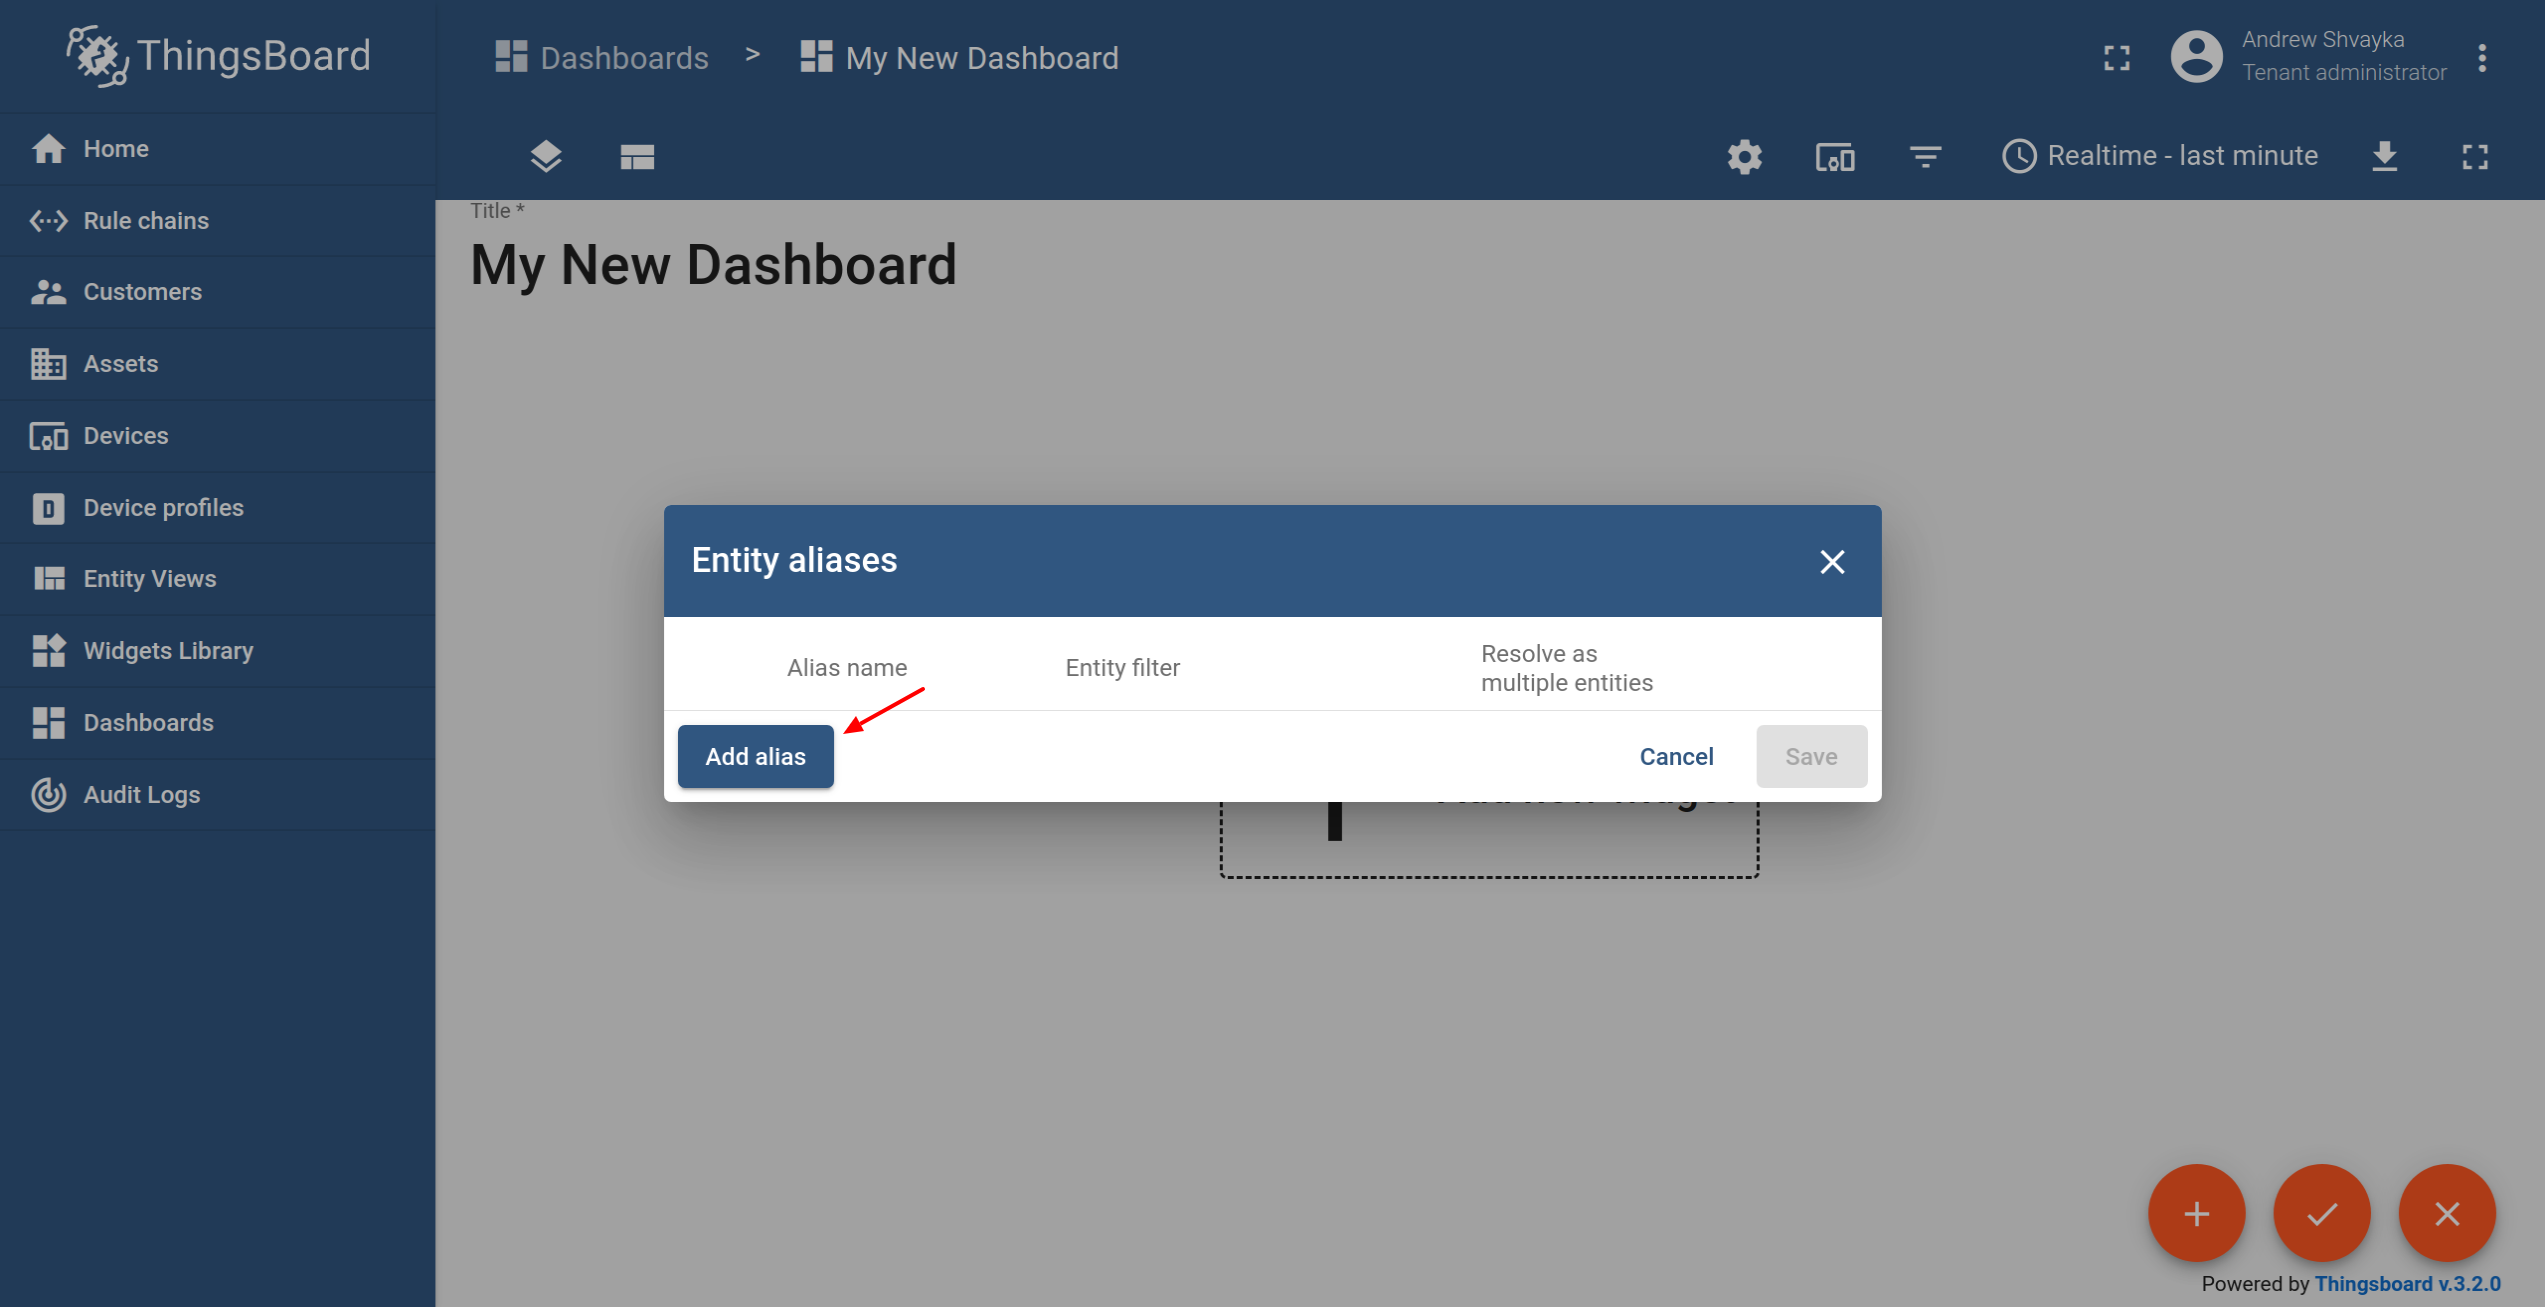
- Click the "Entity Aliases" icon in the top right part of the screen. You will see an empty list of Entity aliases.
- Clique em "Adicionar alias".
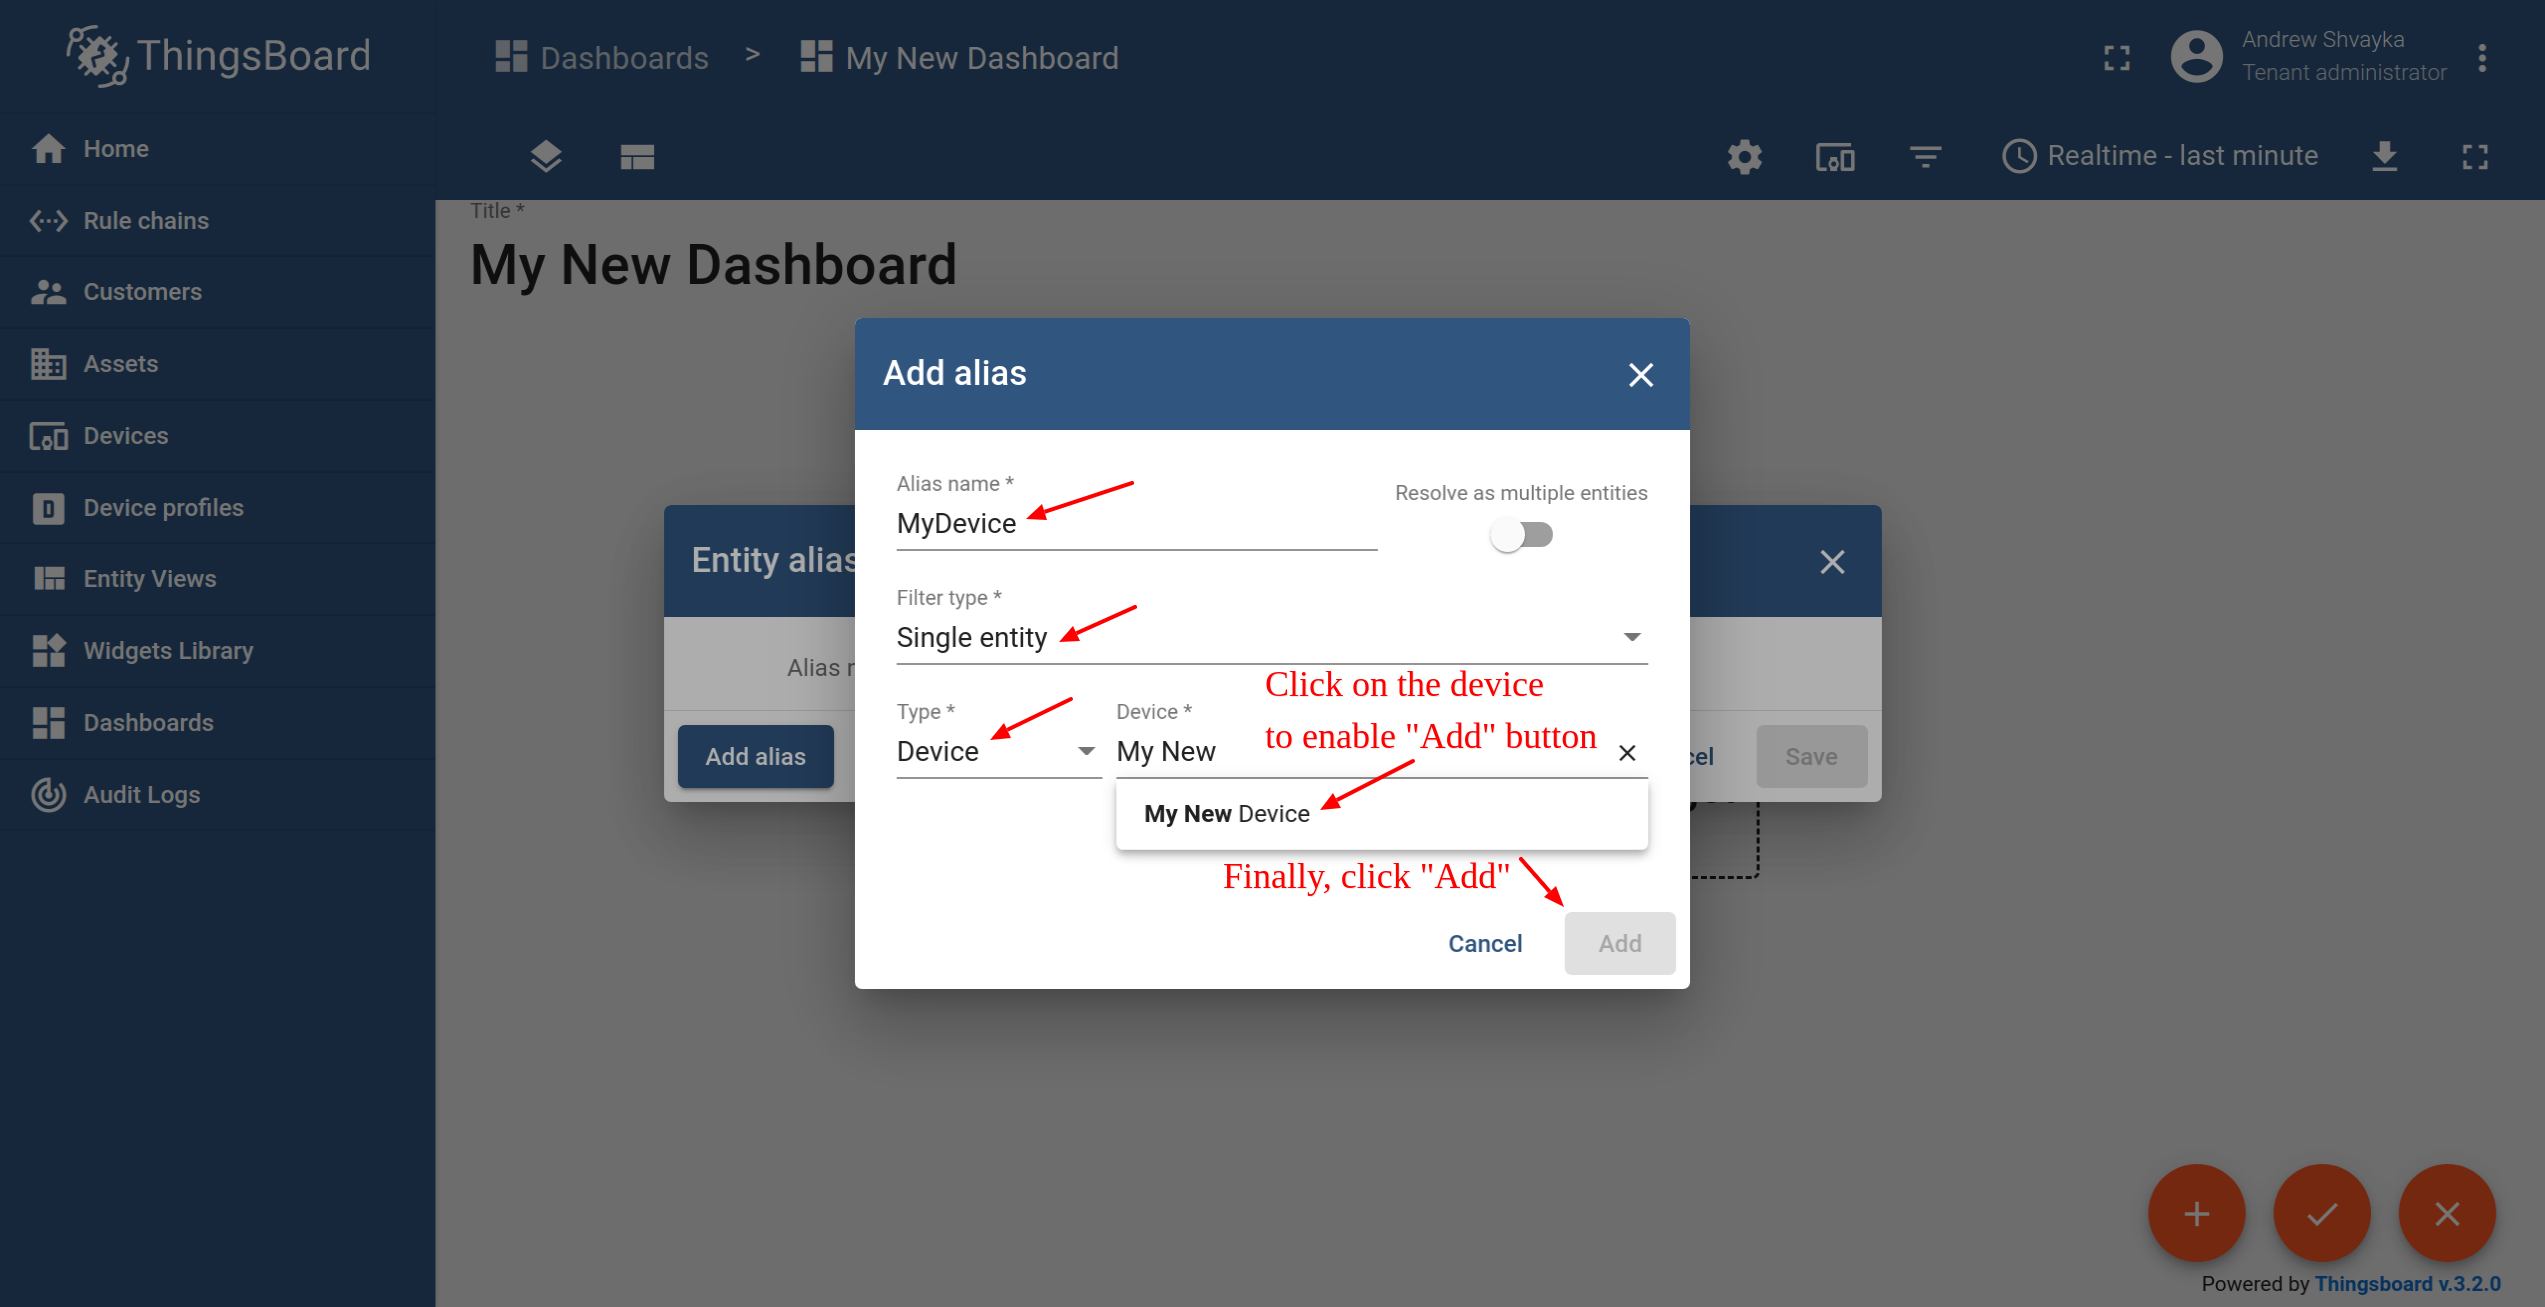
- Input alias name, for example, "MyDevice". Select the "Single entity" Filter type. Select "Device" as Type and type "My New" to enable autocomplete. Choose your device from the auto-complete and click on it.
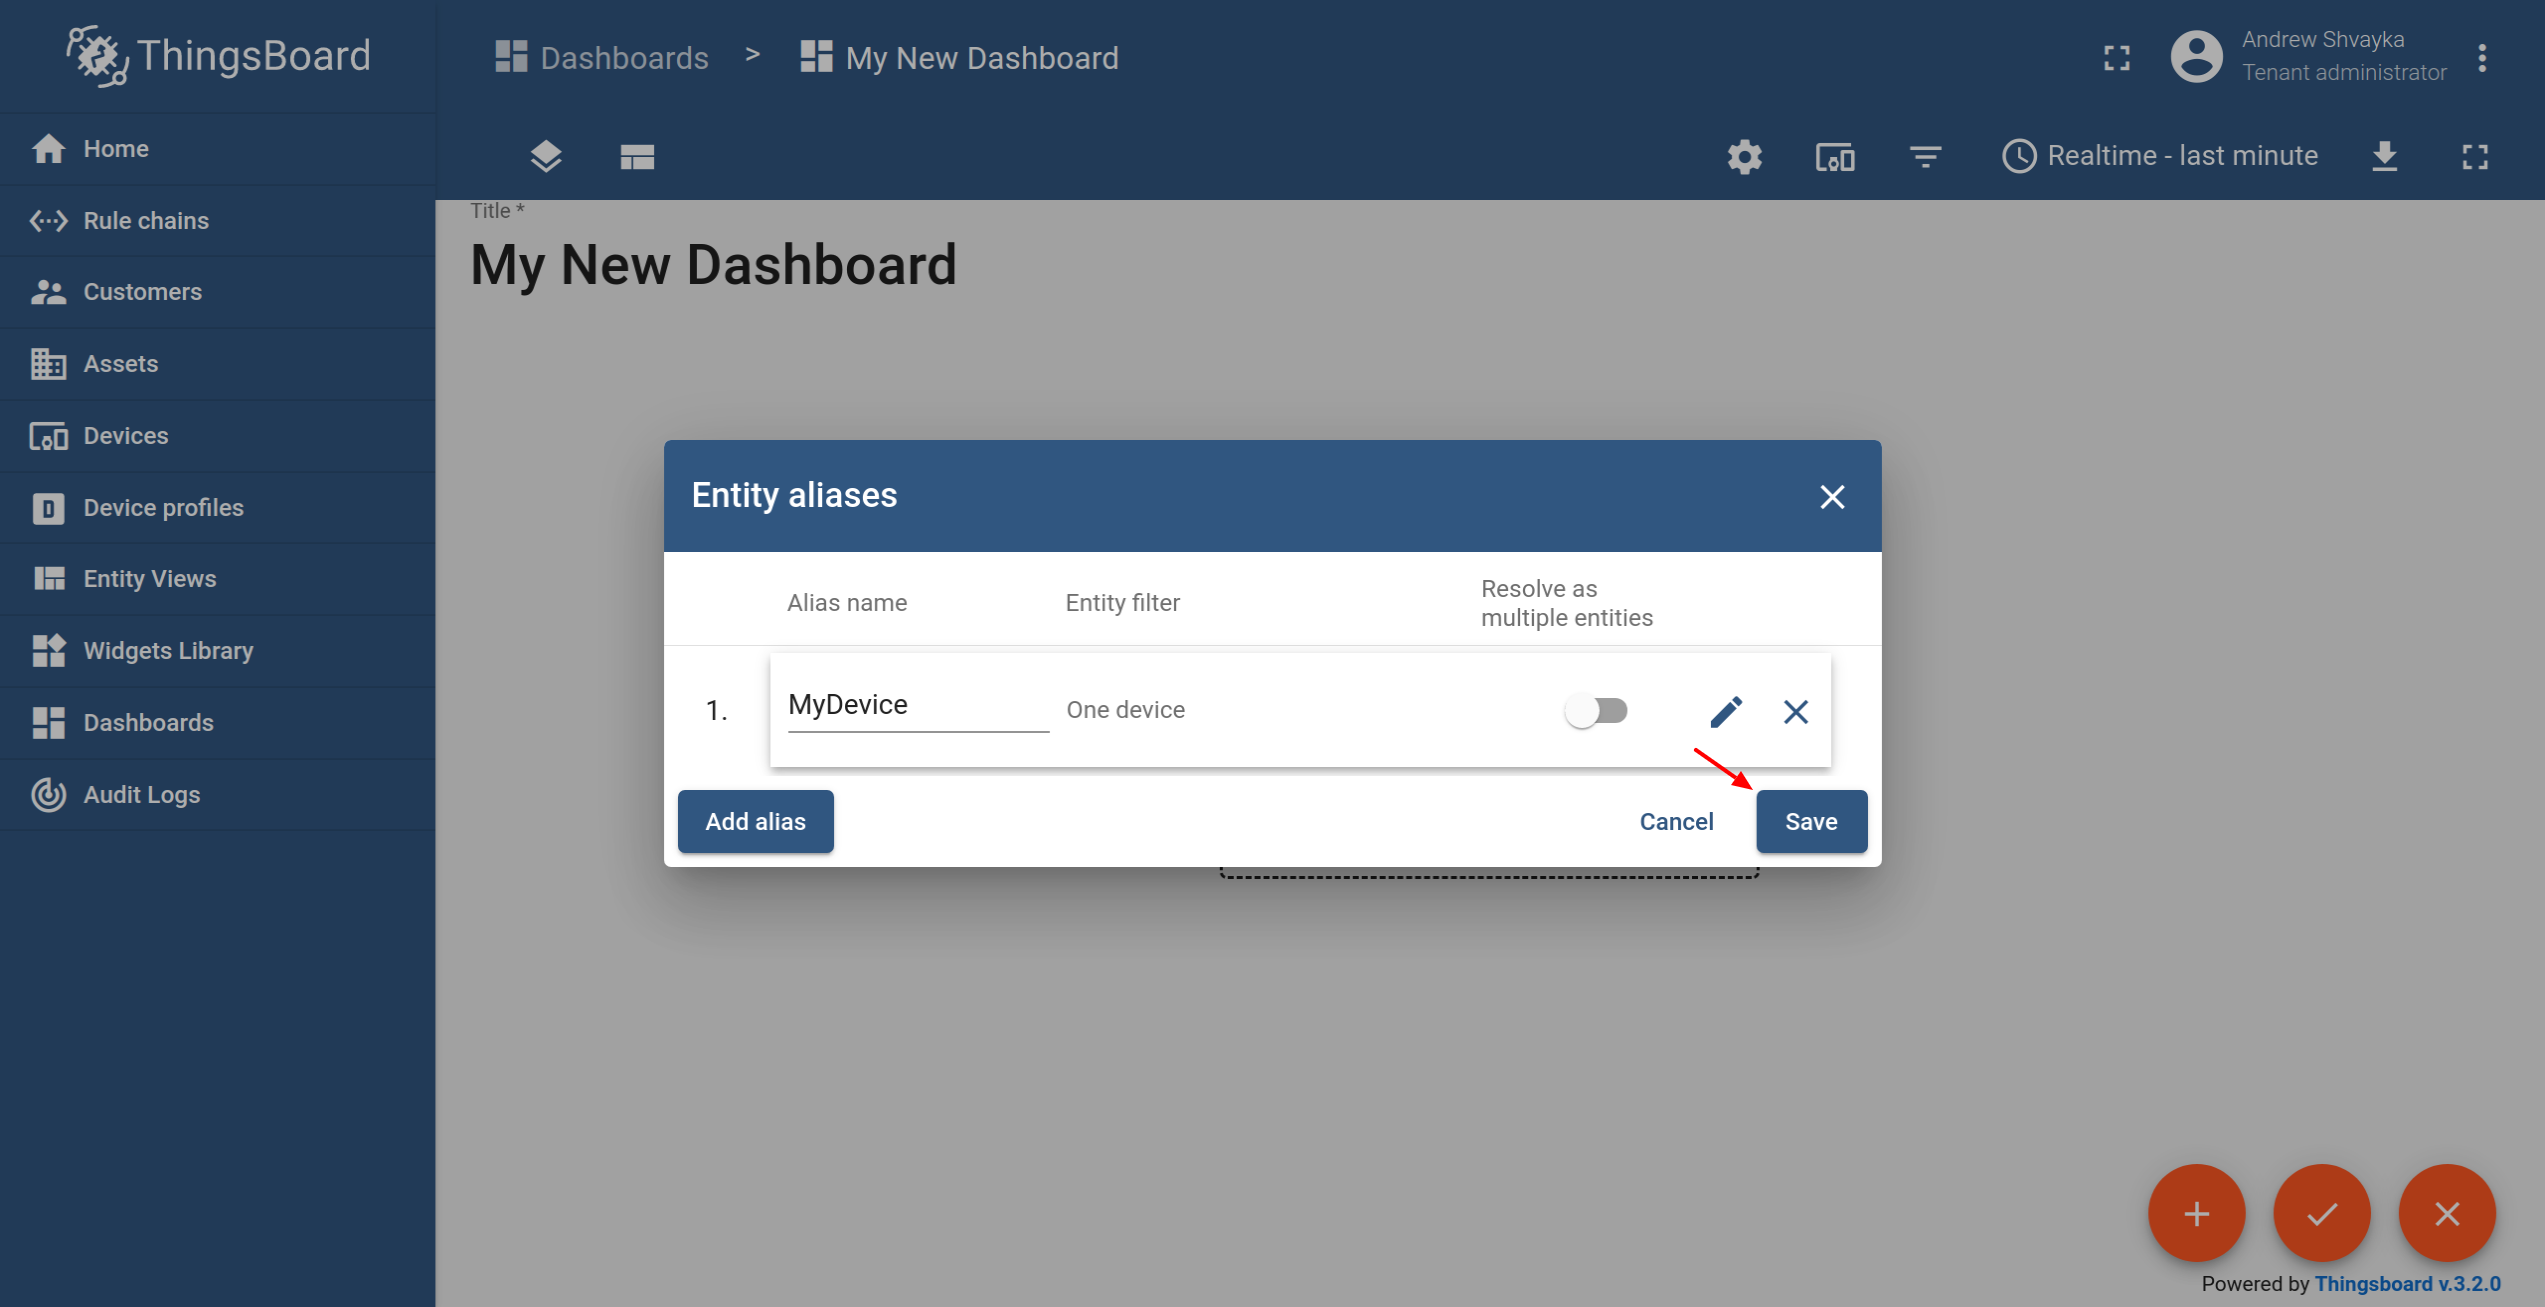
- Clique em "Adicionar" e em "Salvar".
- Por fim, clique em "Aplicar alterações" no editor do painel para salvar as alterações. Então você deve entrar no modo de edição novamente.
Passo 3.3 Adicionar widget
Para adicionar o widget de tabela, precisamos selecioná-lo na biblioteca de widgets. Os widgets são agrupados em pacotes de widgets. Cada widget possui uma fonte de dados. É assim que o widget “sabe” quais dados exibir. Para ver o valor mais recente de nossos dados de “temperatura” que enviamos durante a etapa 2, devemos configurar a fonte de dados.
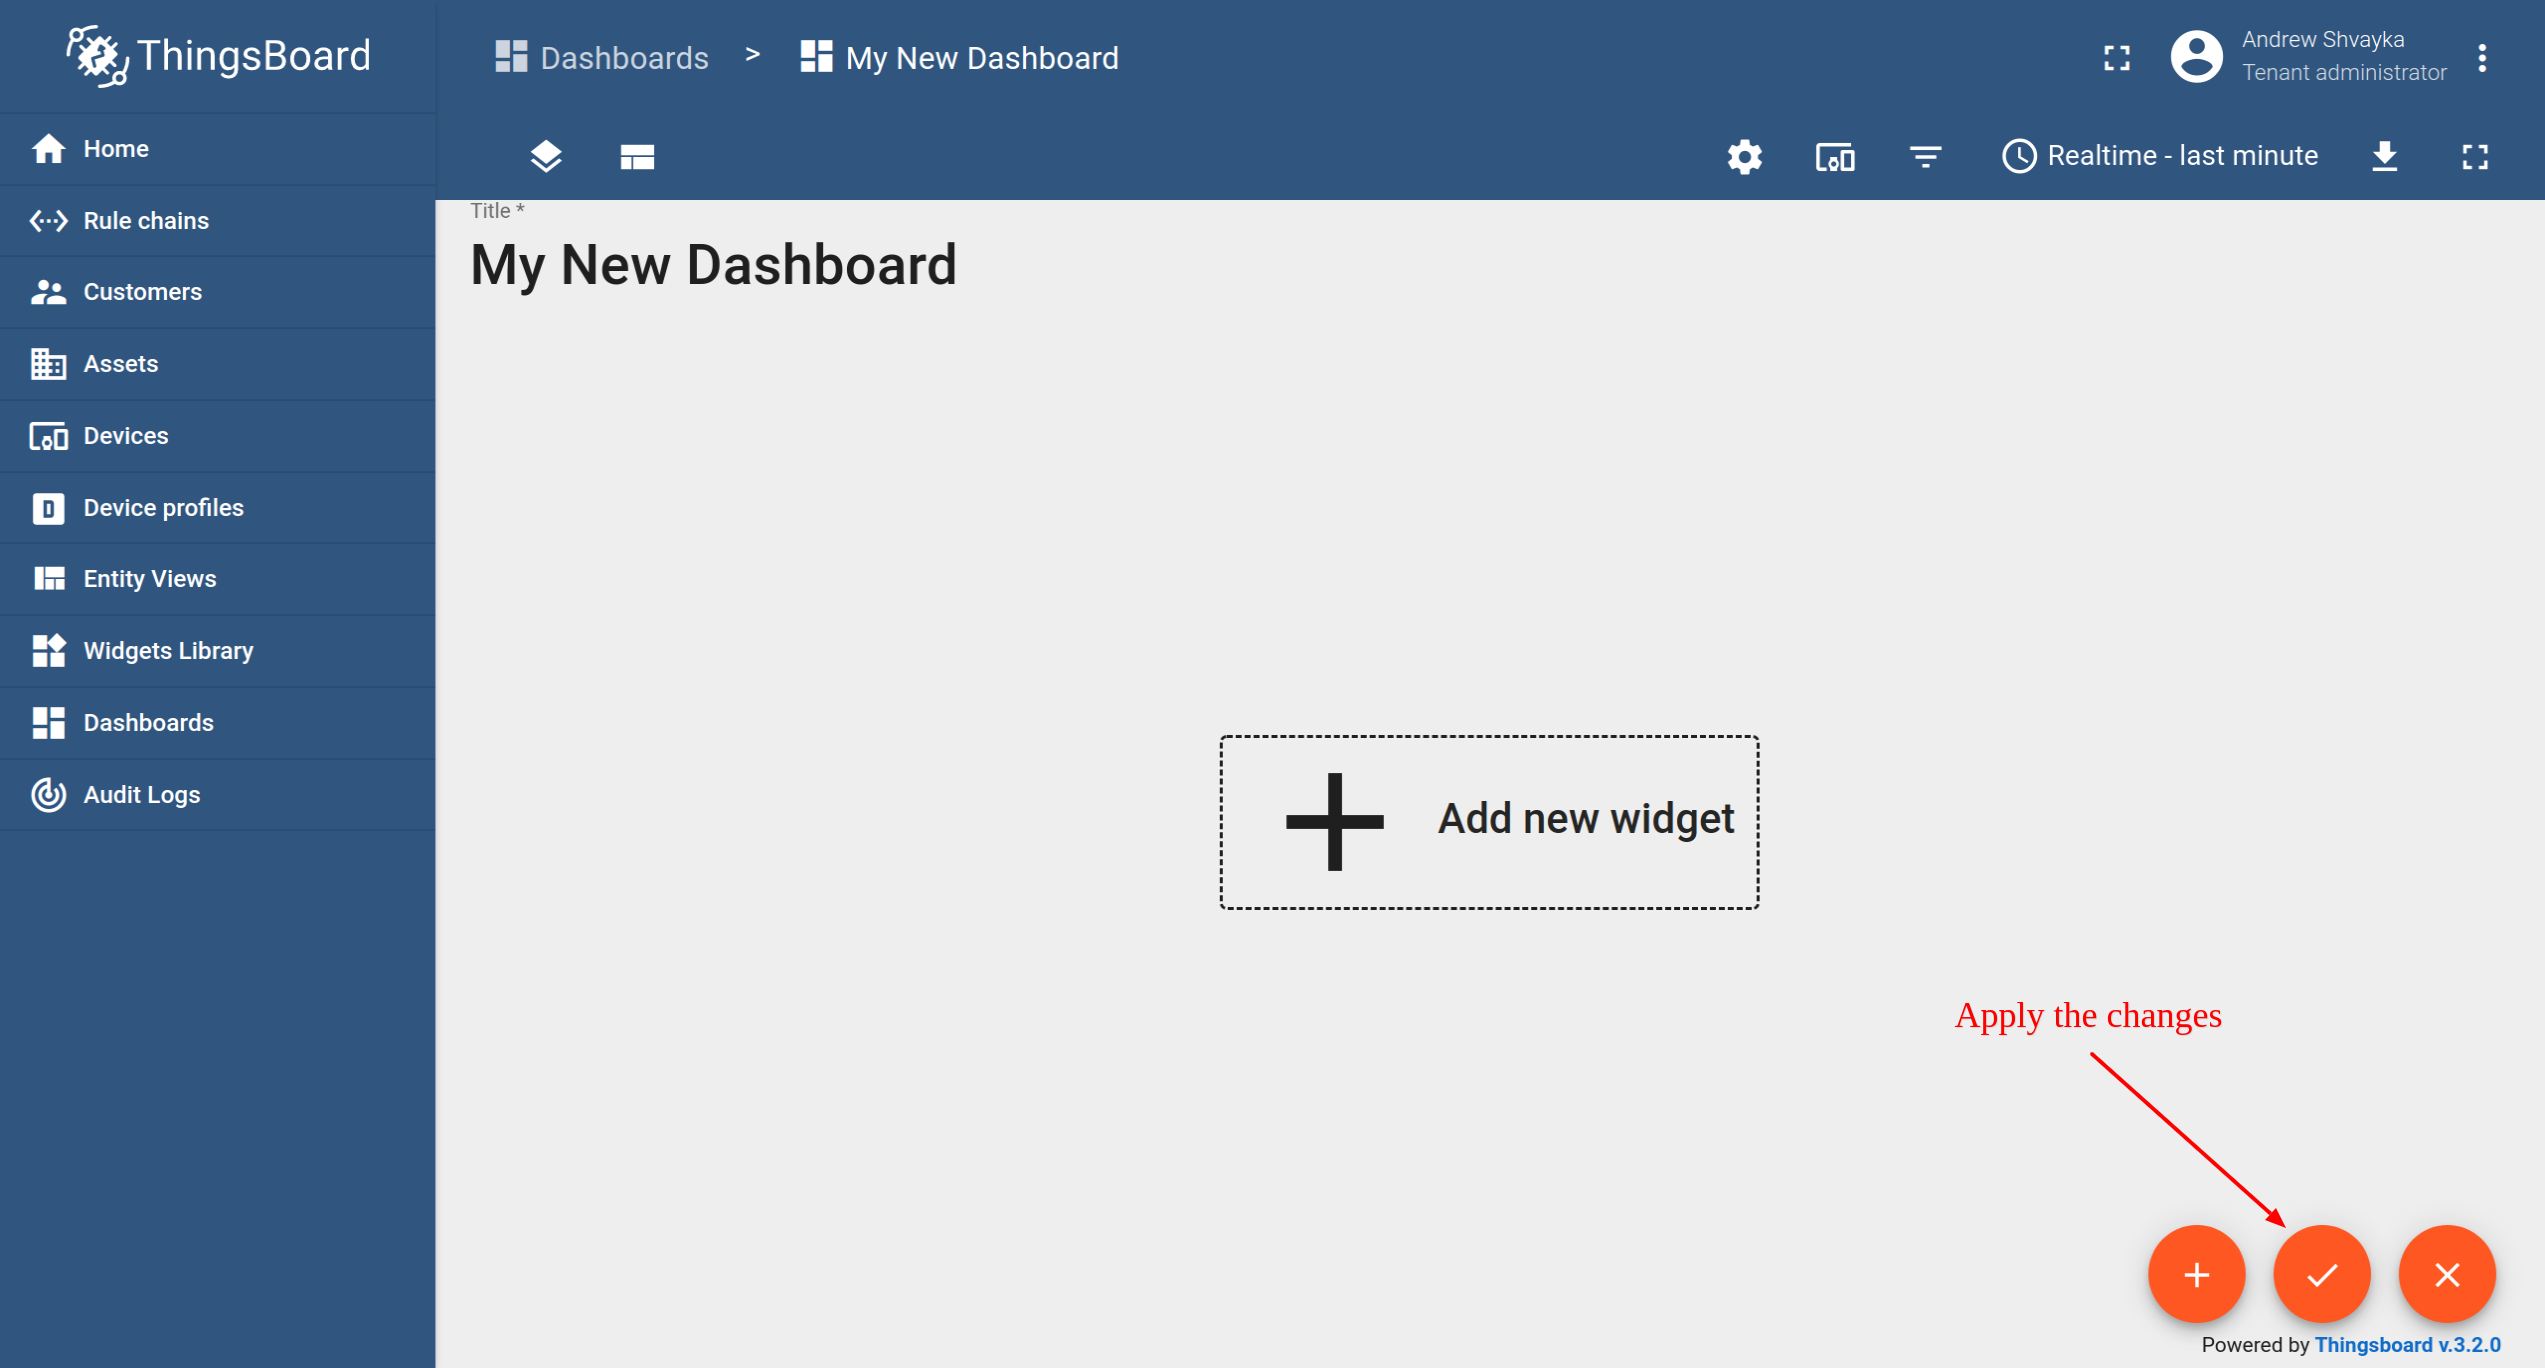
- Entrar no modo de edição. Clique no botão "Adicionar novo widget".
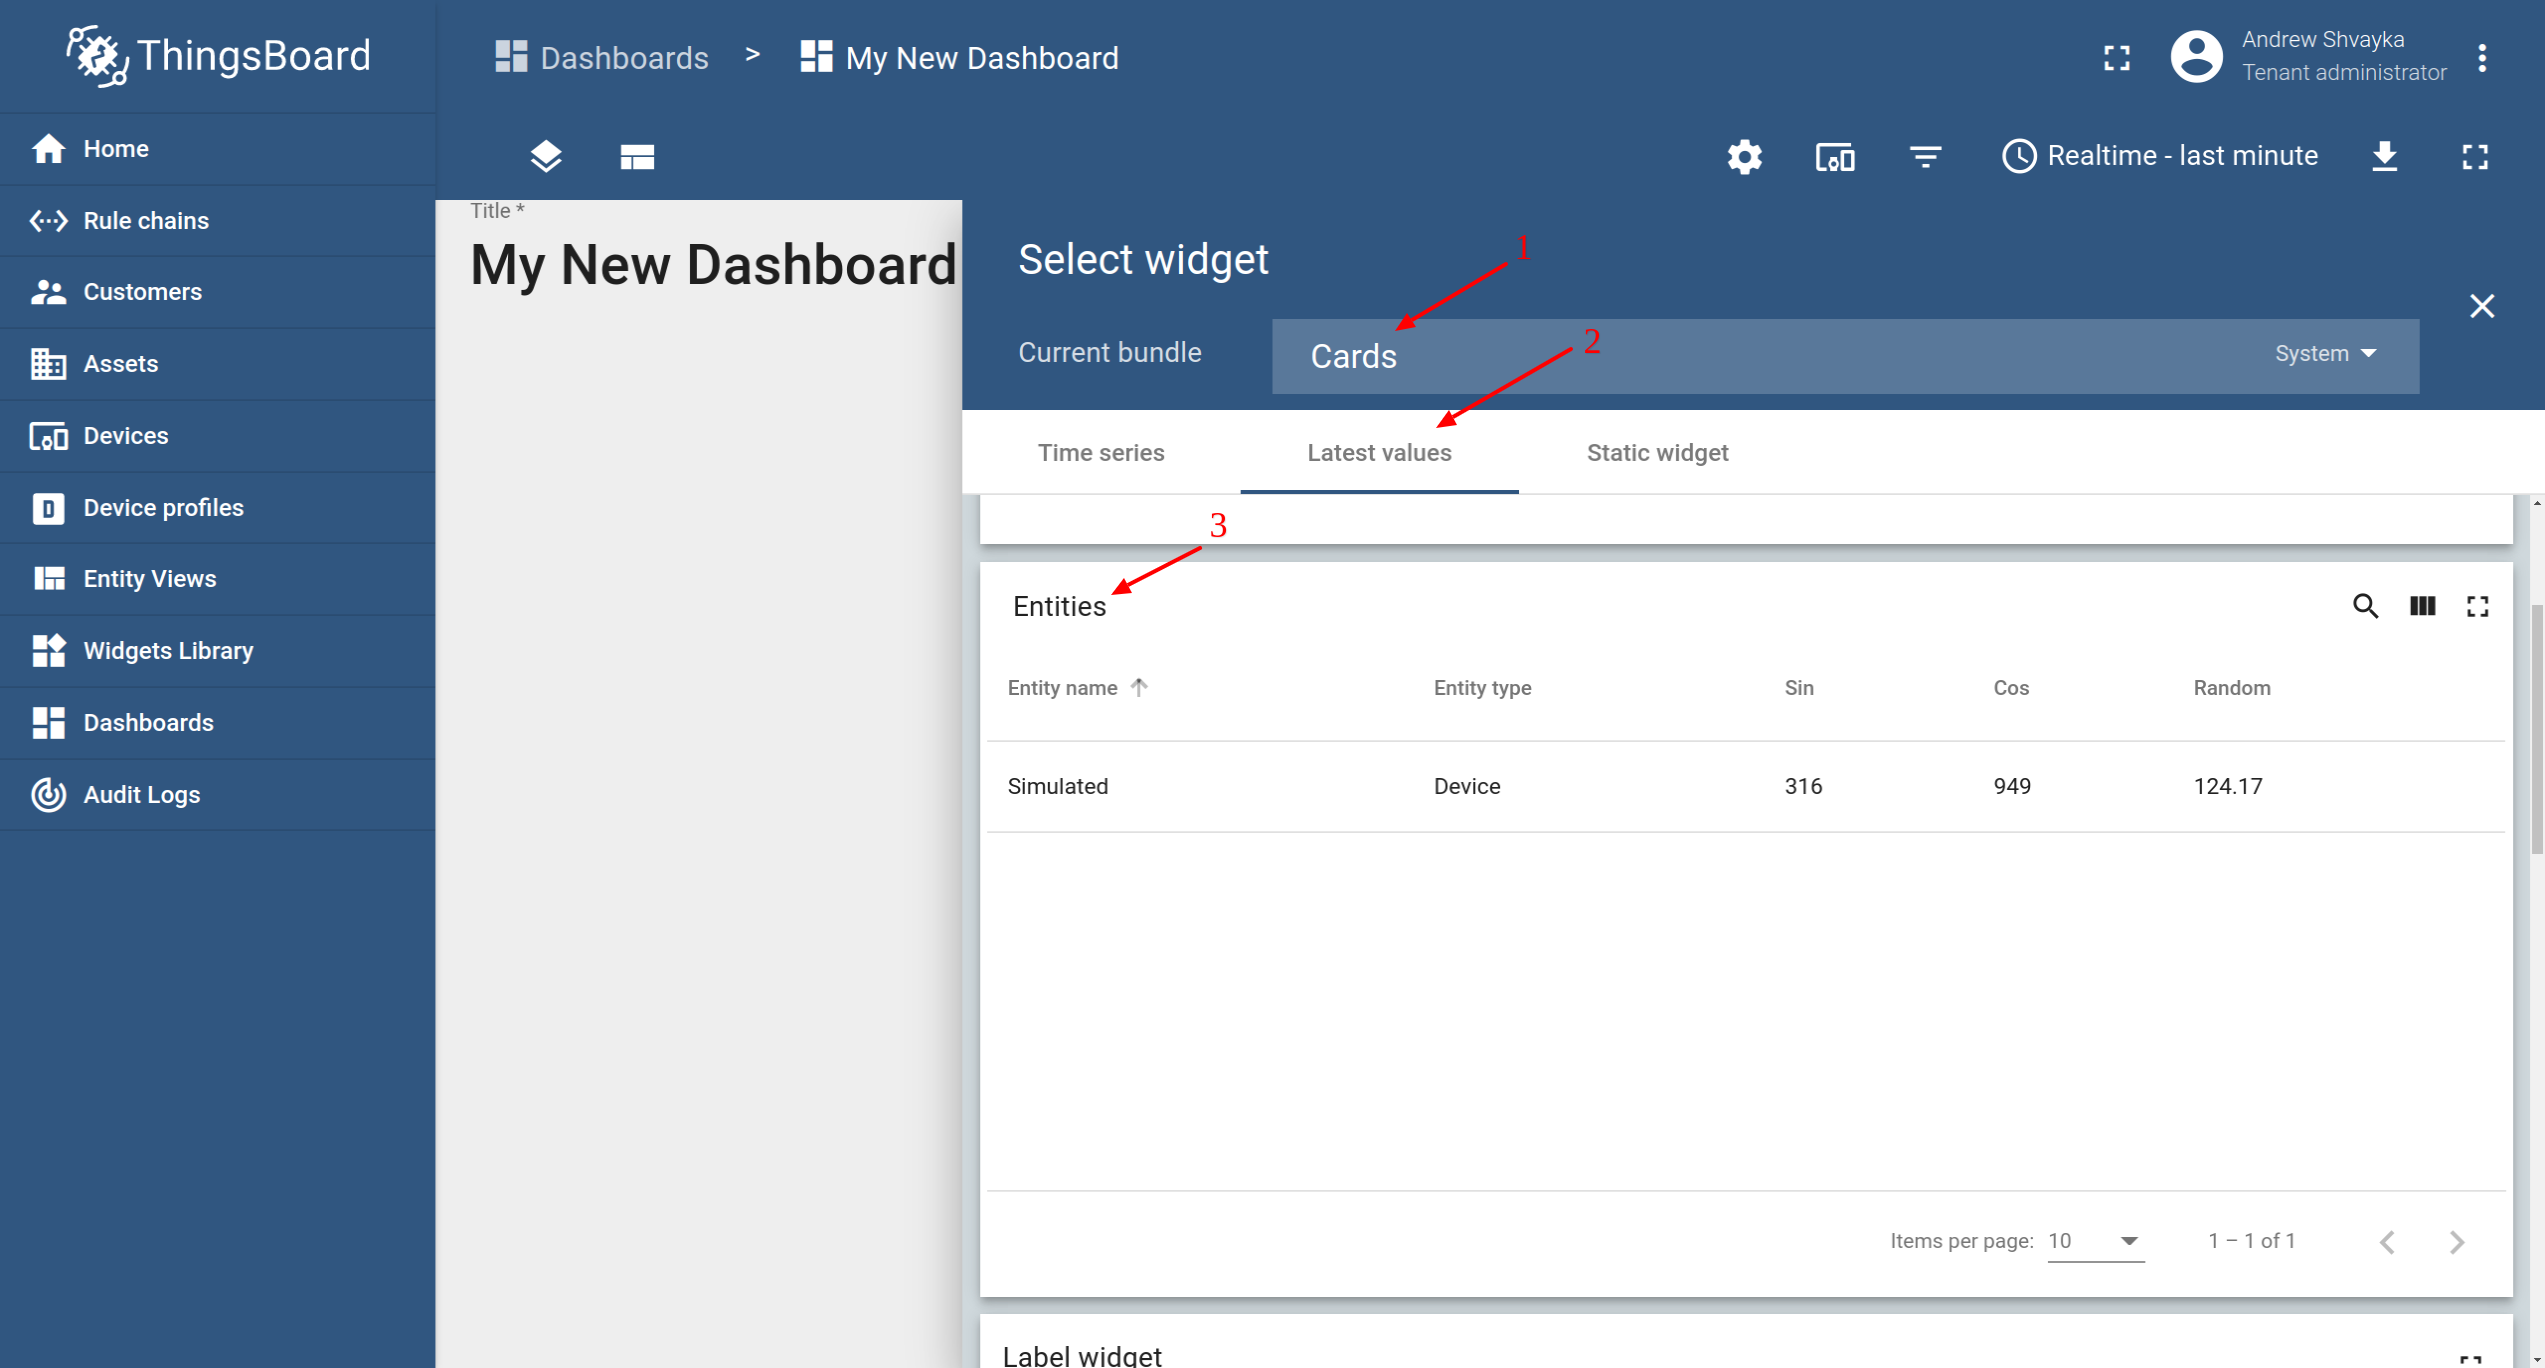
- Select the "Cards" widget bundle. Select the "Latest values" tab. Click on the header of the Entities widget. The "Add Widget" window will appear.
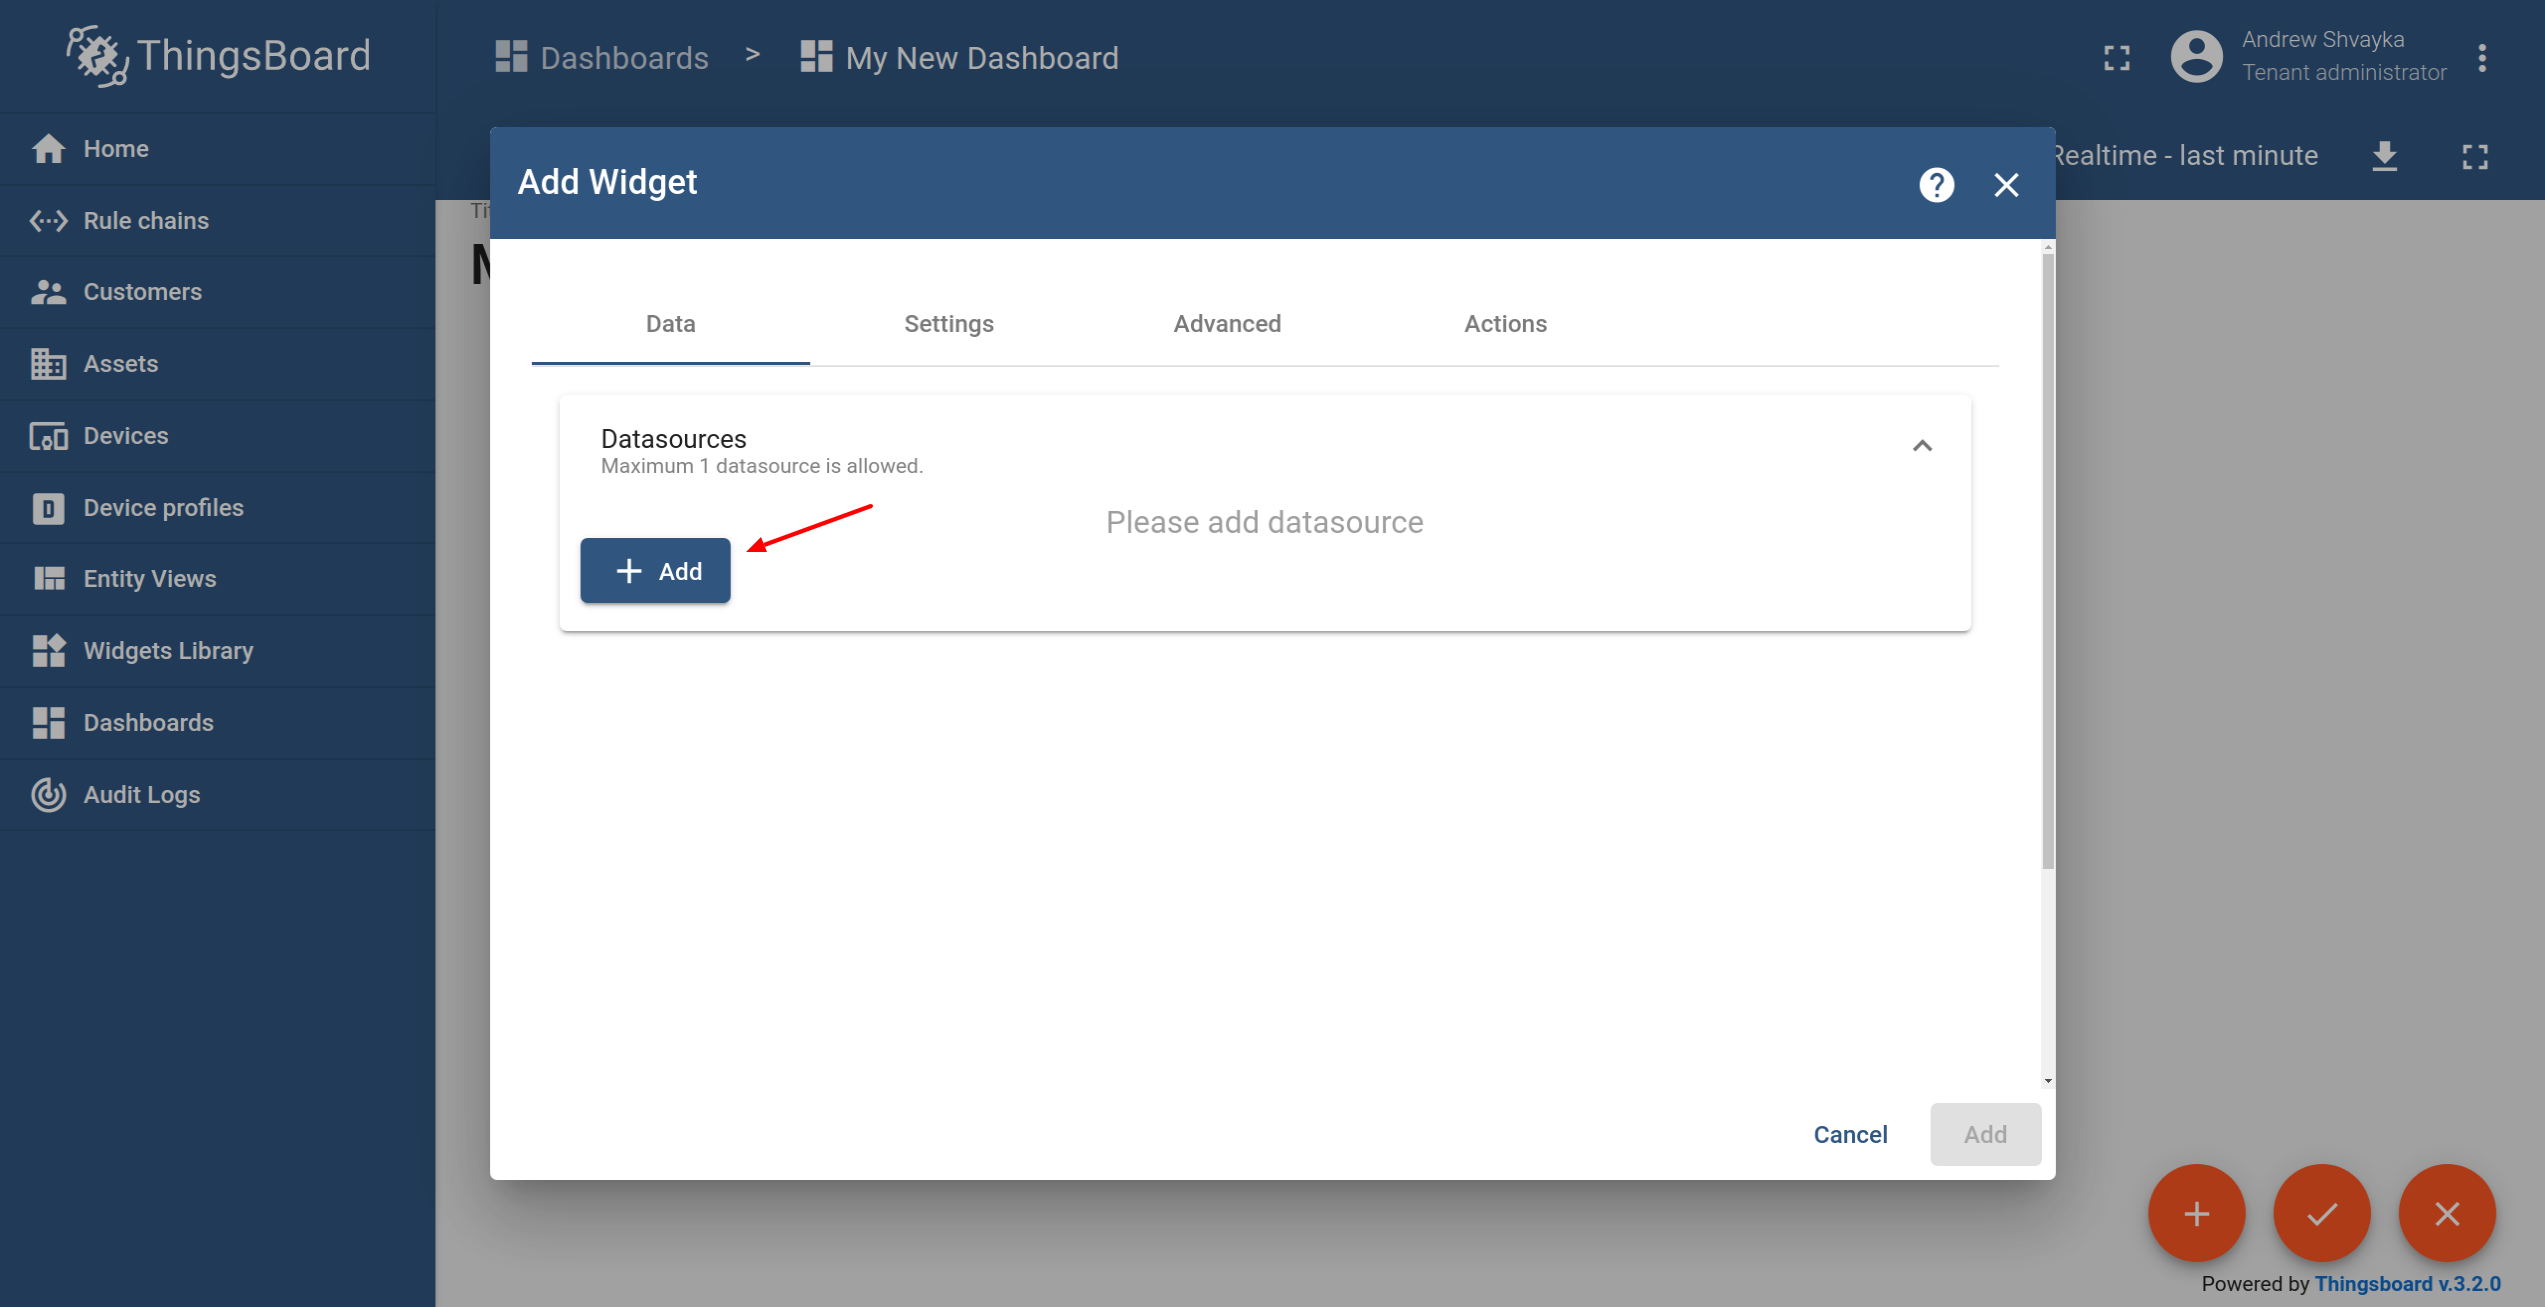
- Click "Add" to add the data source. A widget may have multiple data sources, but we will use only one in this case.
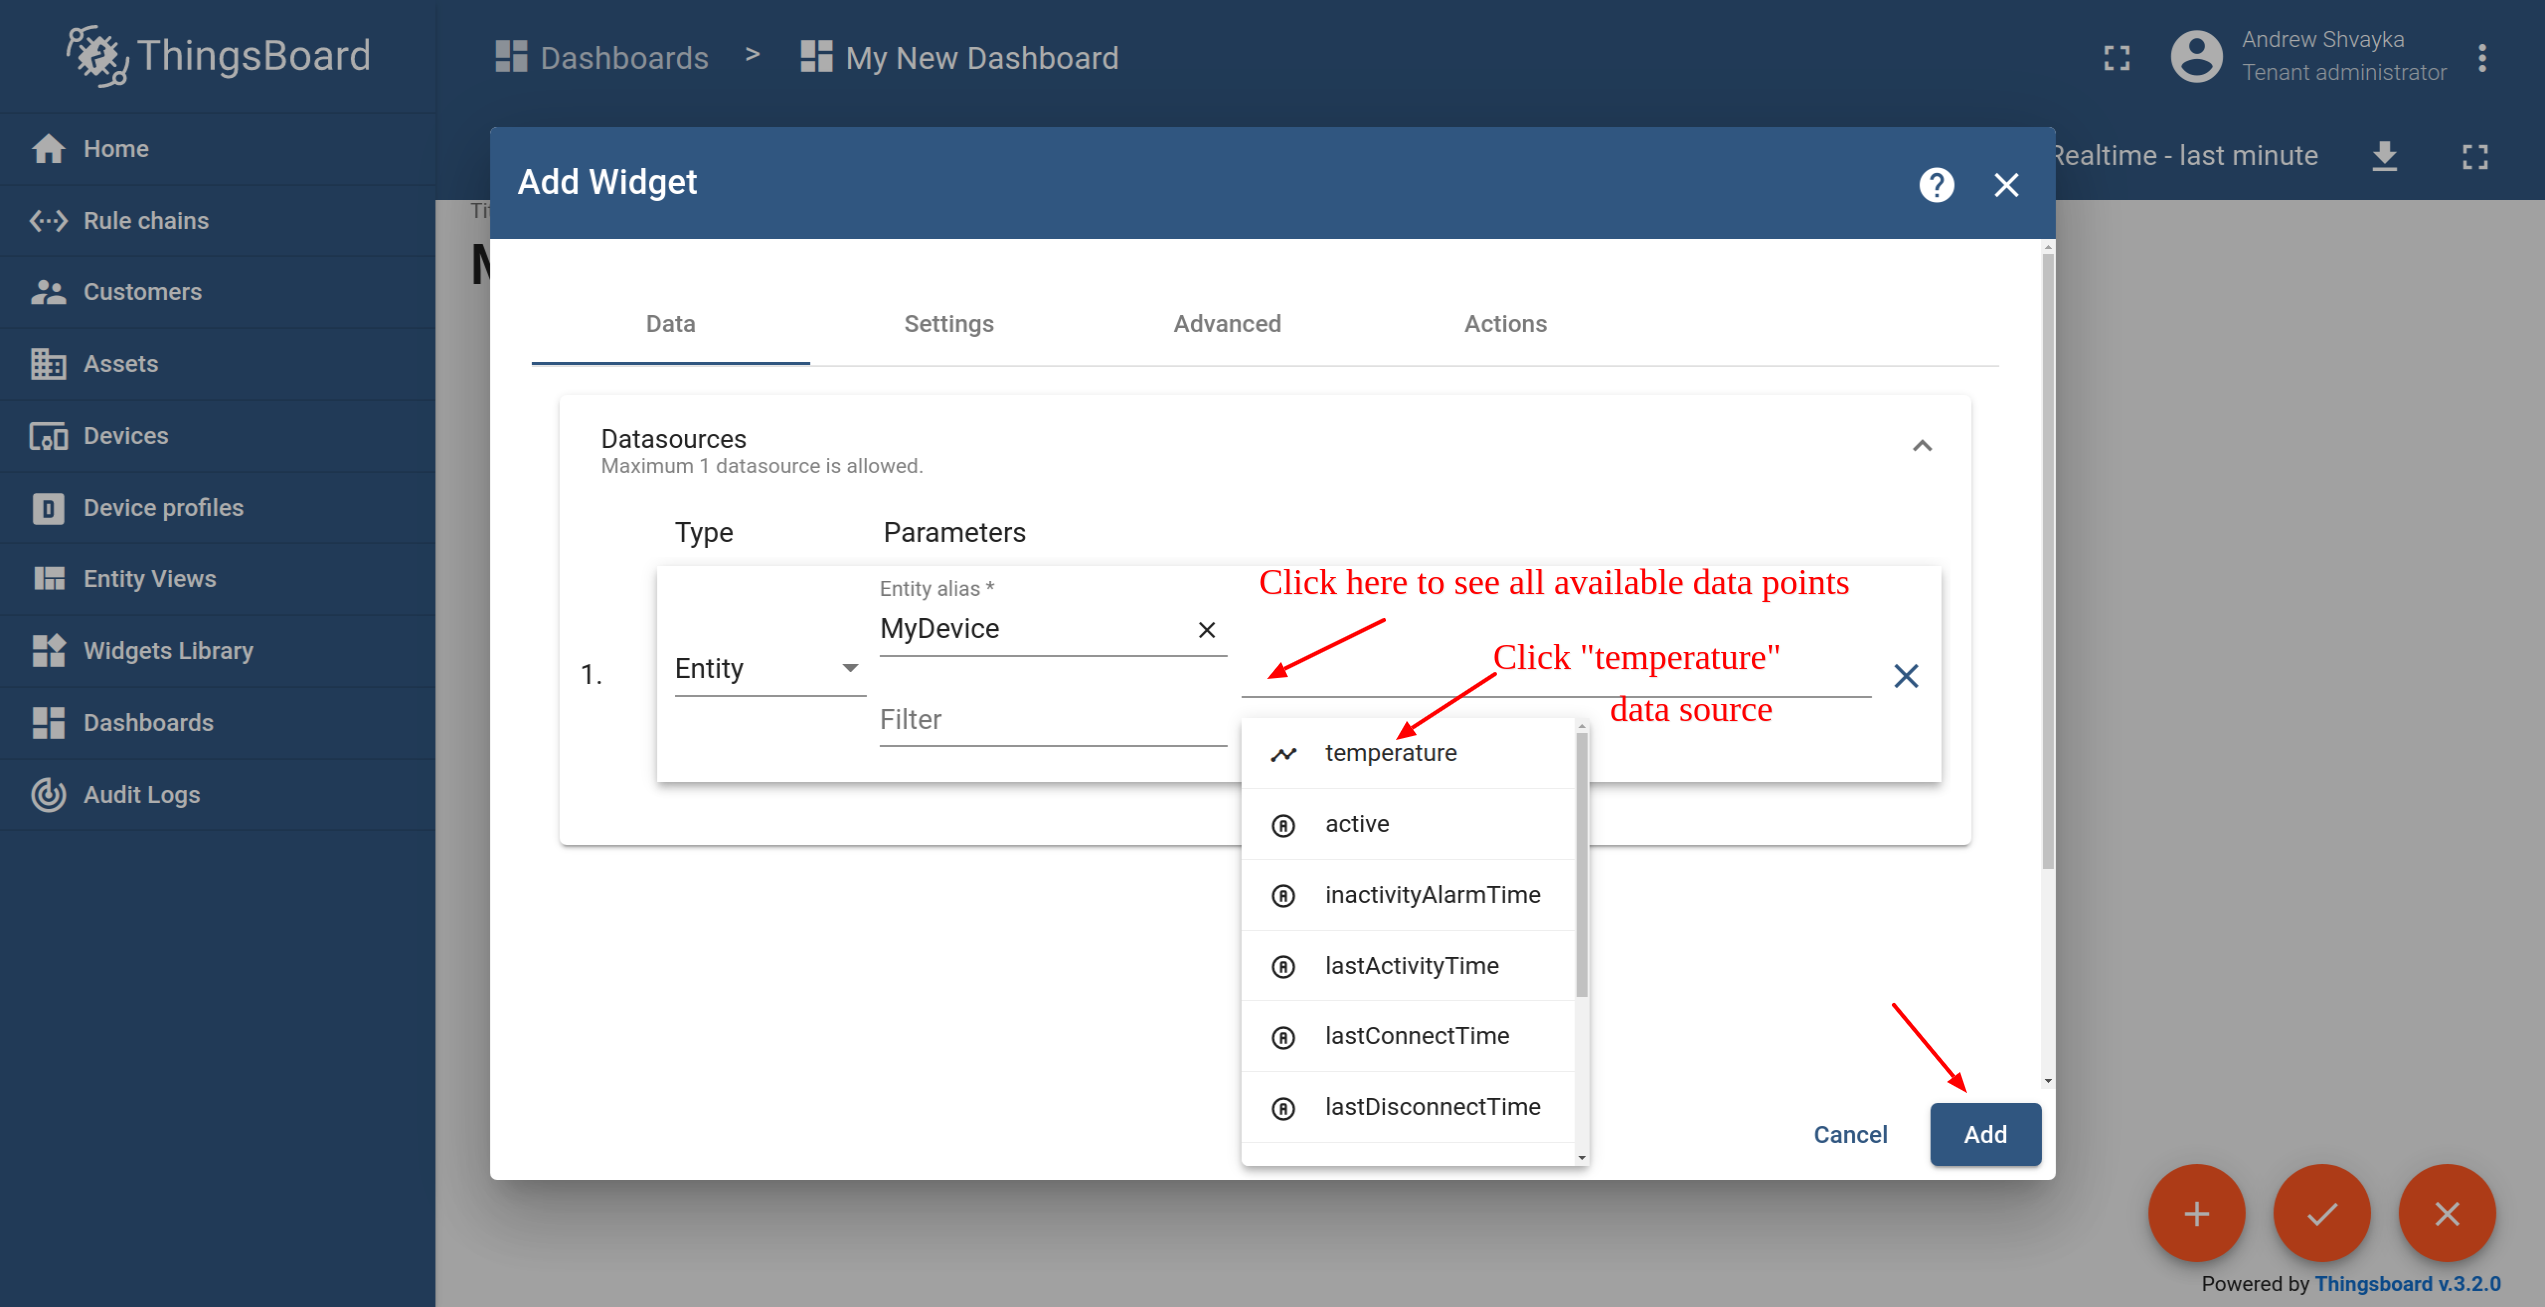
- Select "MyDevice" entity alias. Then click on the input field on the right. The auto-complete with available data points will appear. Select "temperature" data point and click "Add".
- Resize the widget to make it a little bigger. Just drag the bottom right corner of the widget. You can also play with the advanced settings if you would like to edit the widget.

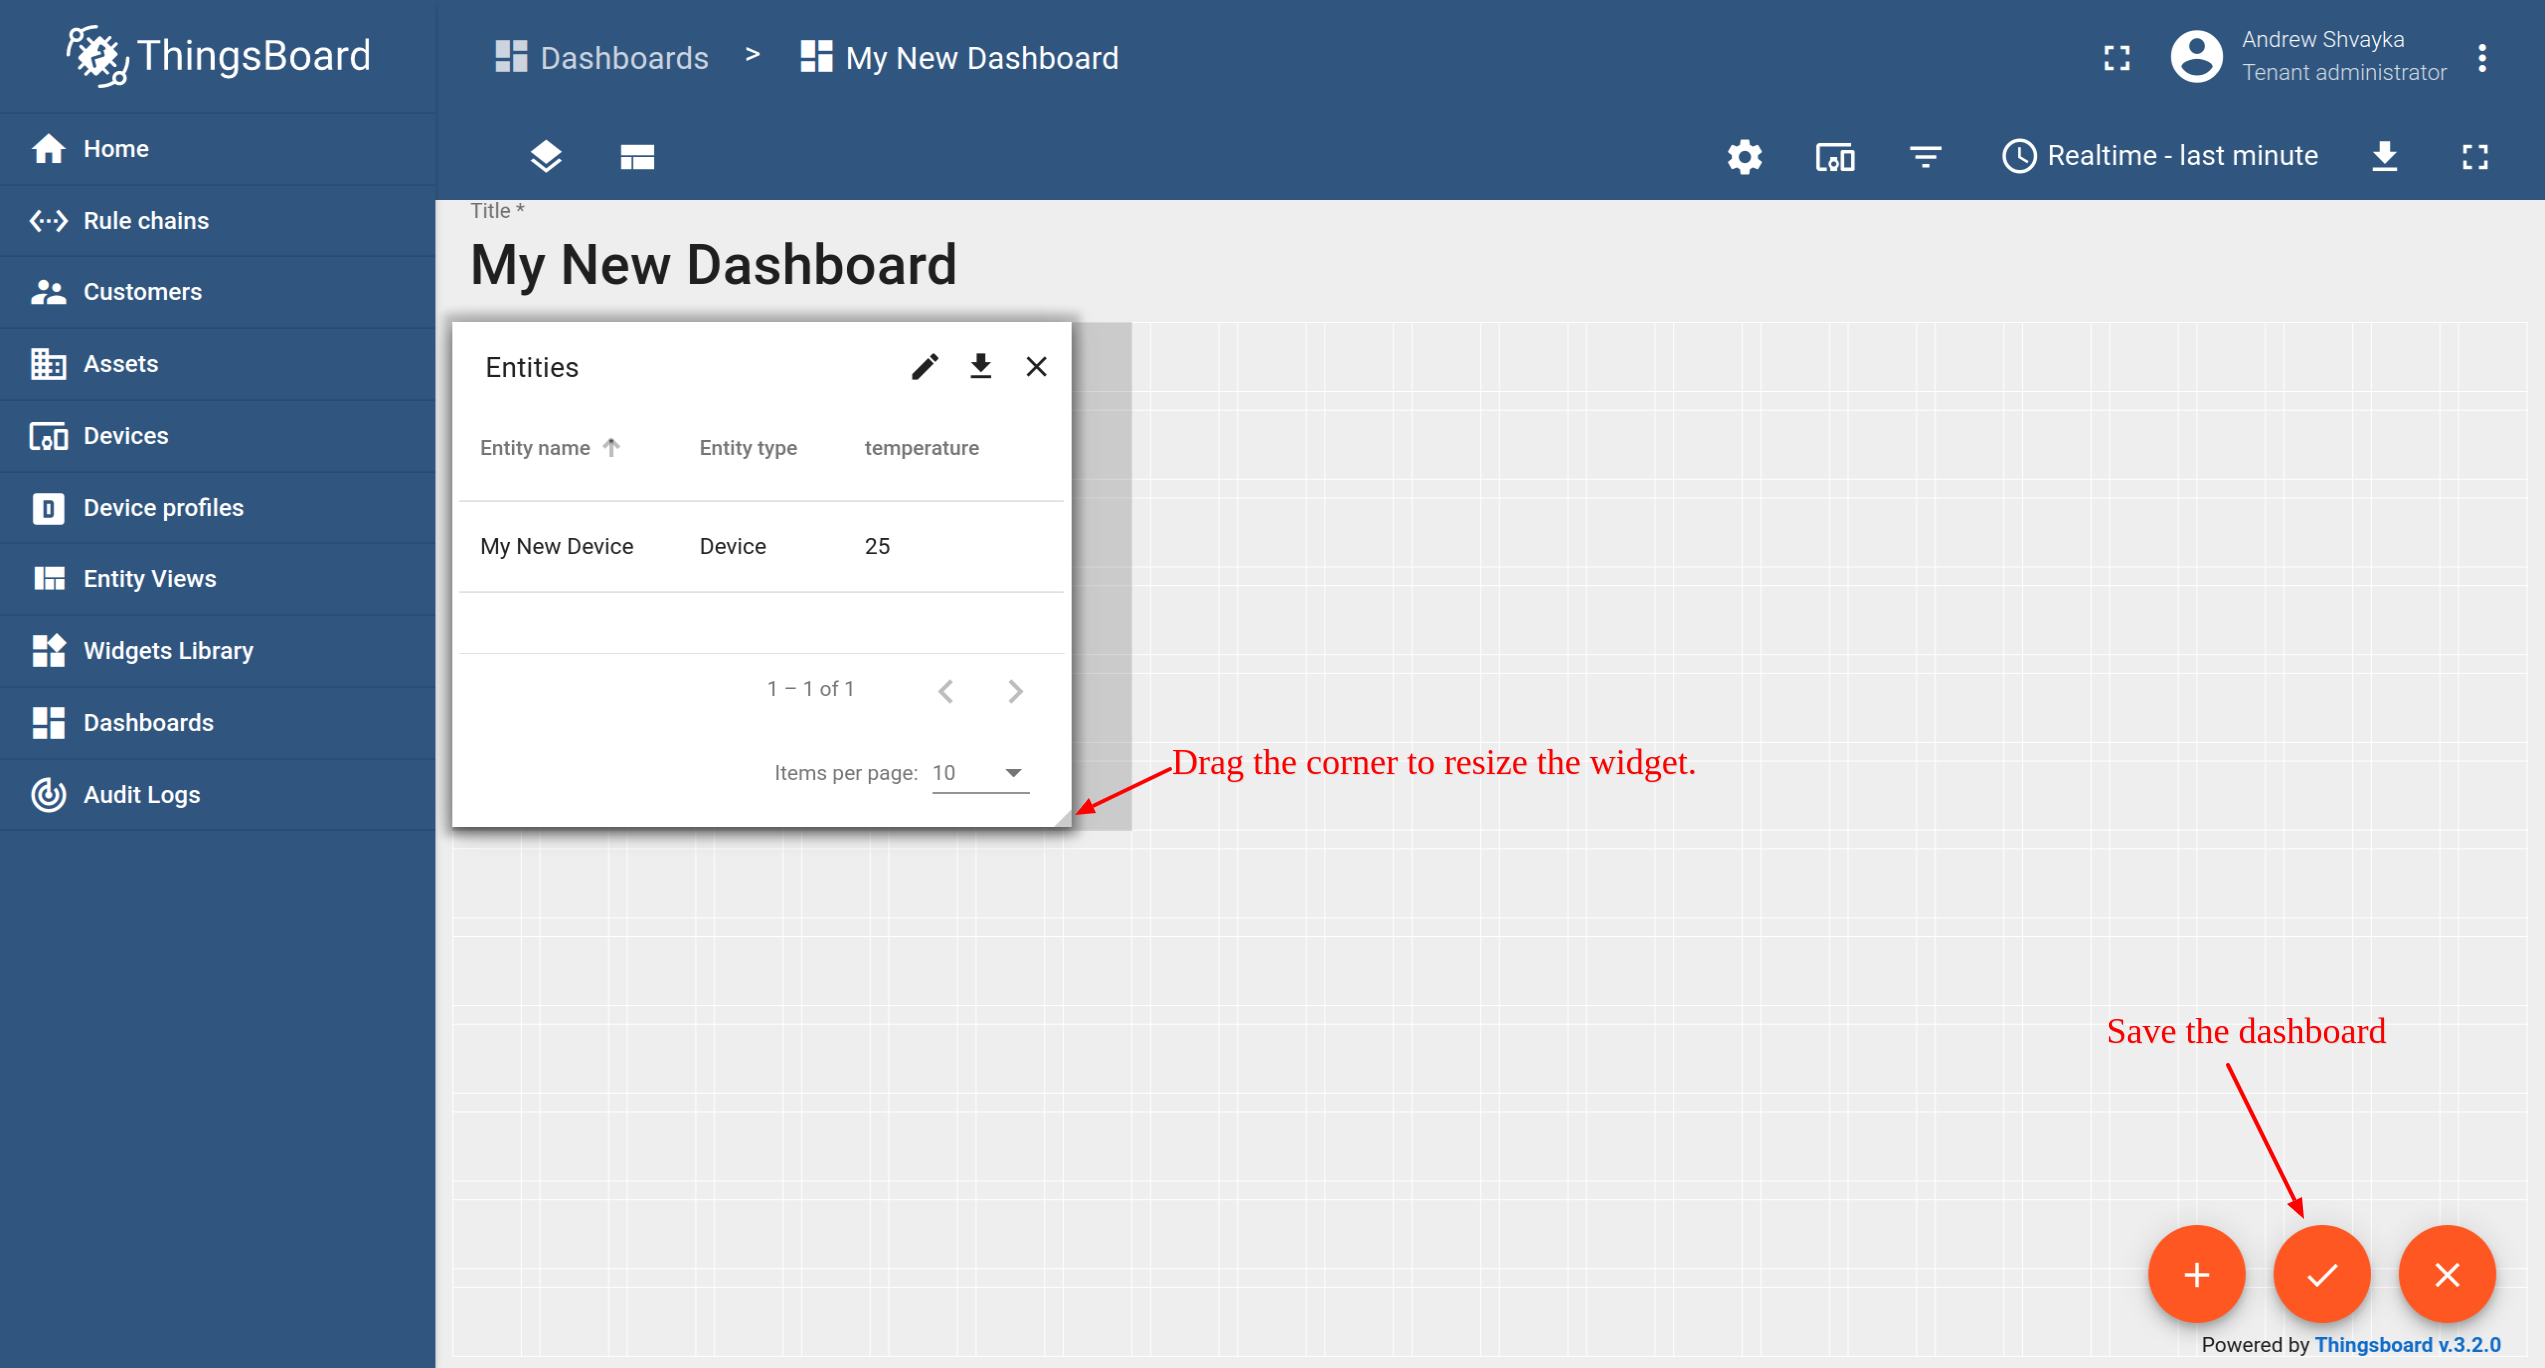
Congratulations! You have added the first widget. Now you can send new telemetry reading and it will immediately appear in the table.
Passo 3.4 Adicionar widget de gráfico
Para adicionar o widget de gráfico, precisamos selecioná-lo na biblioteca de widgets. O widget de gráfico exibe vários valores históricos da mesma chave de dados ("temperatura" em nosso caso). Devemos também configurar a janela de tempo para usar o widget de gráfico.
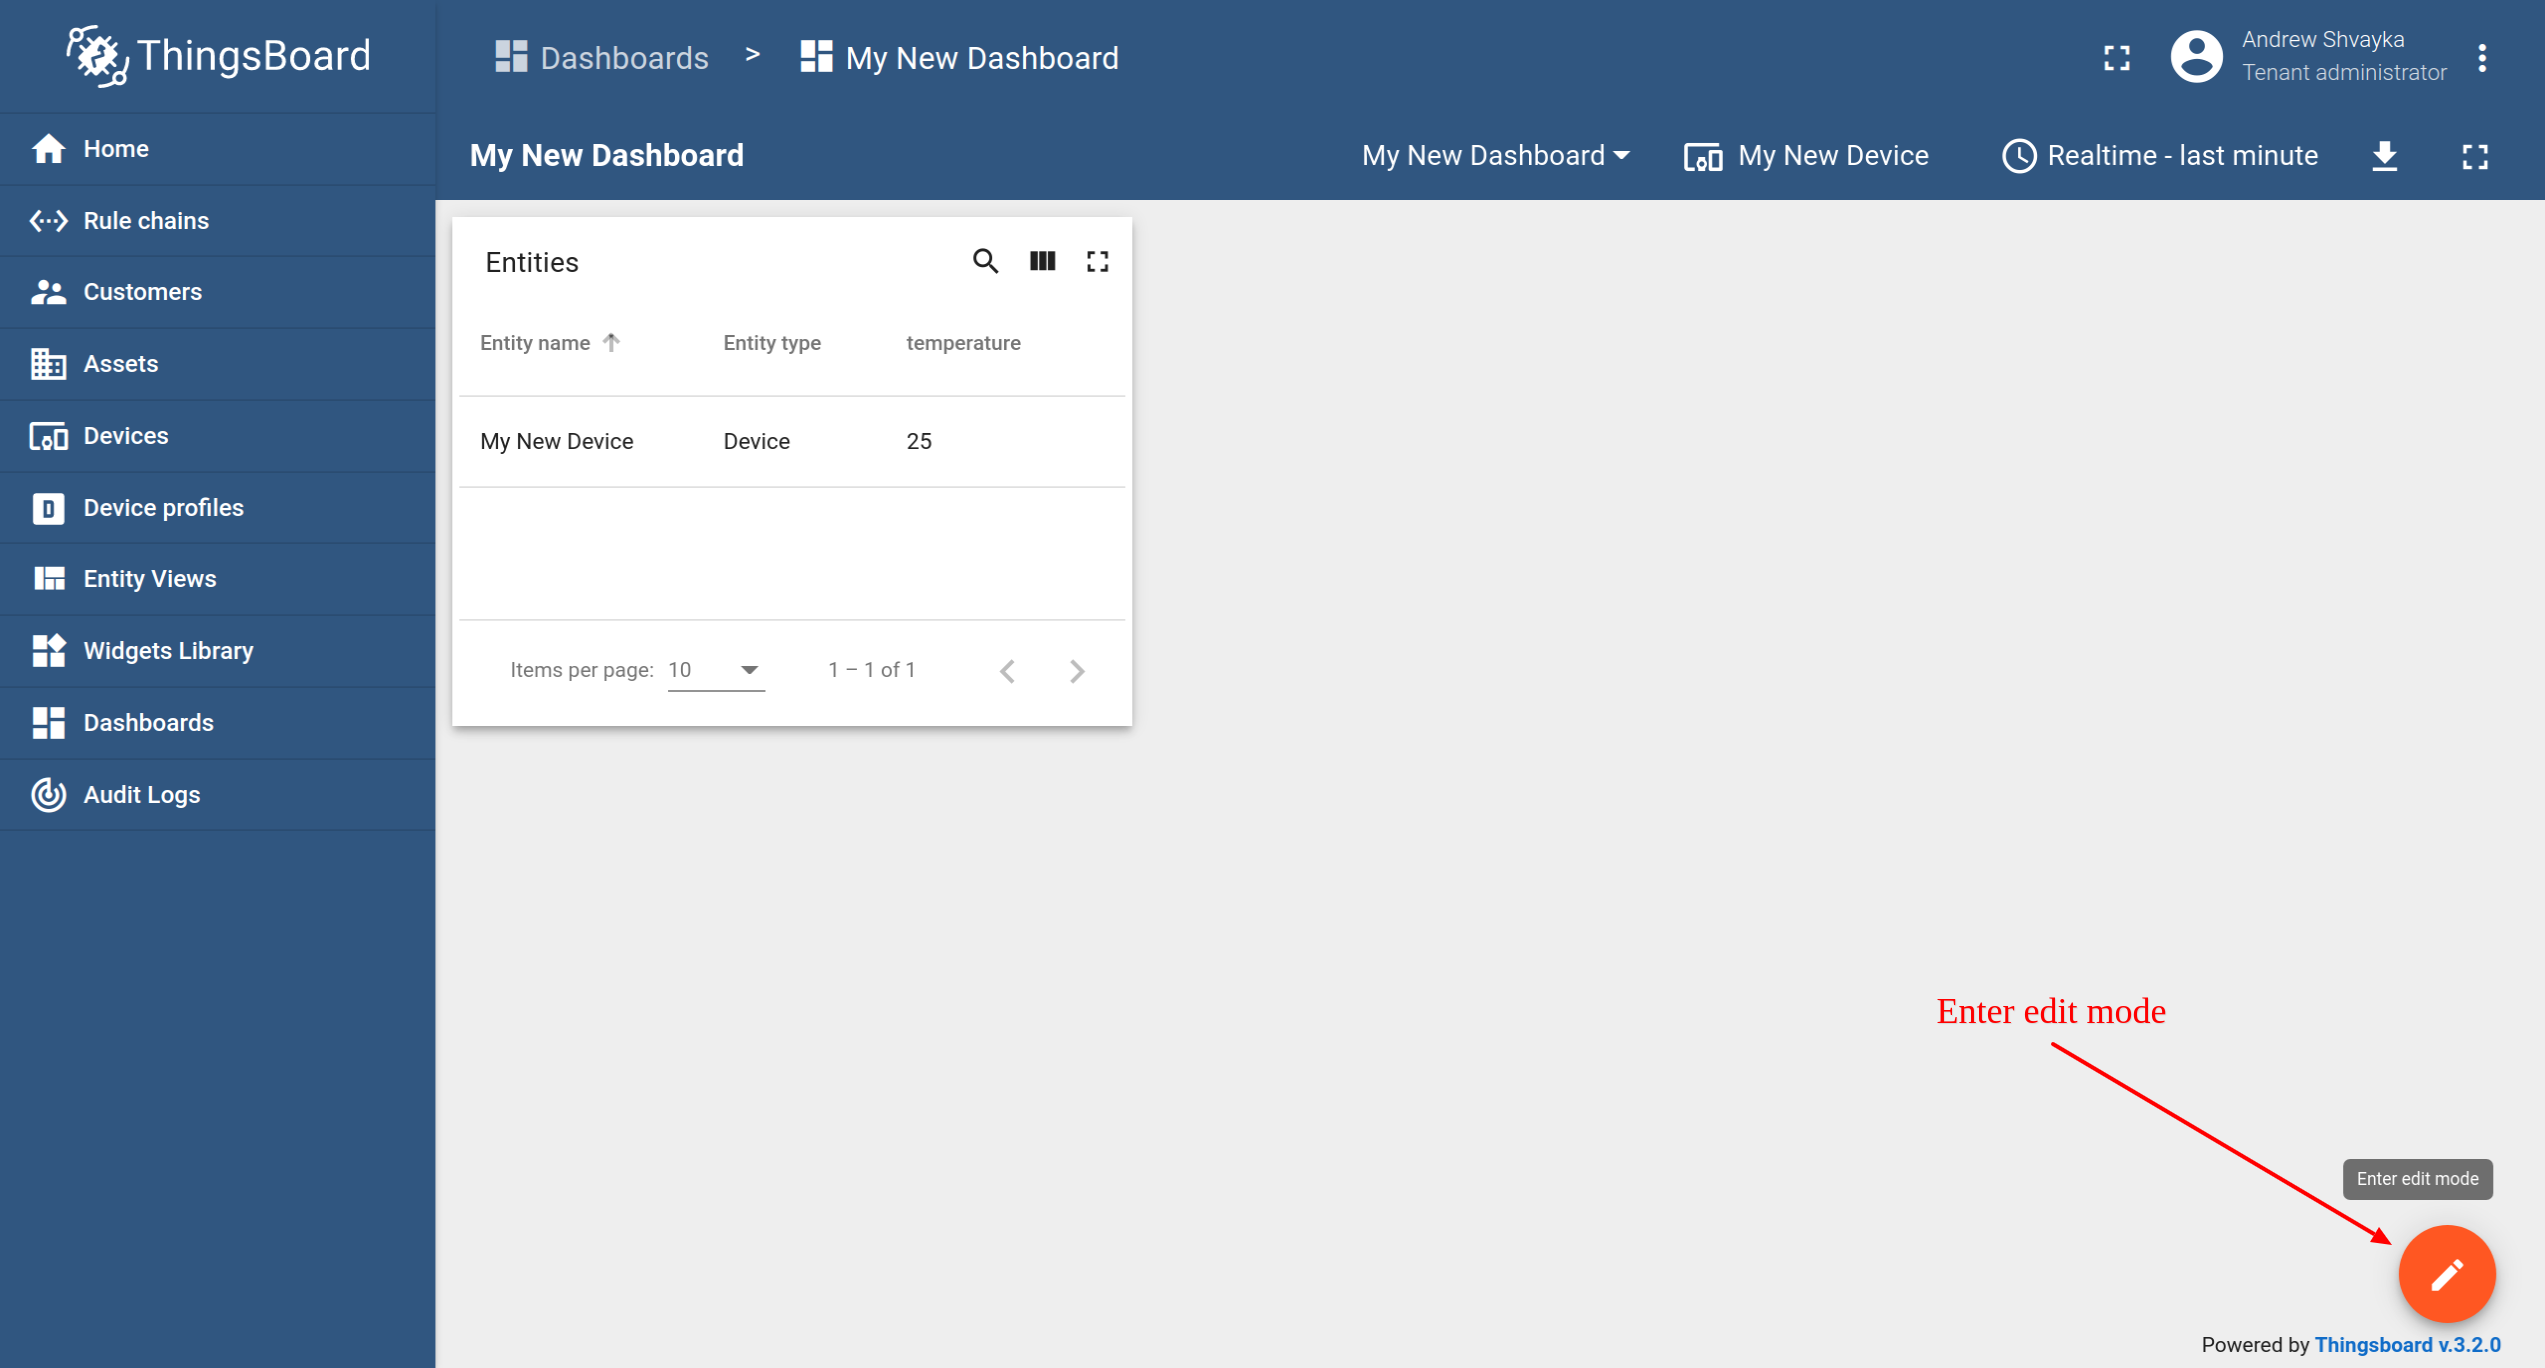
- Entre no modo de edição.
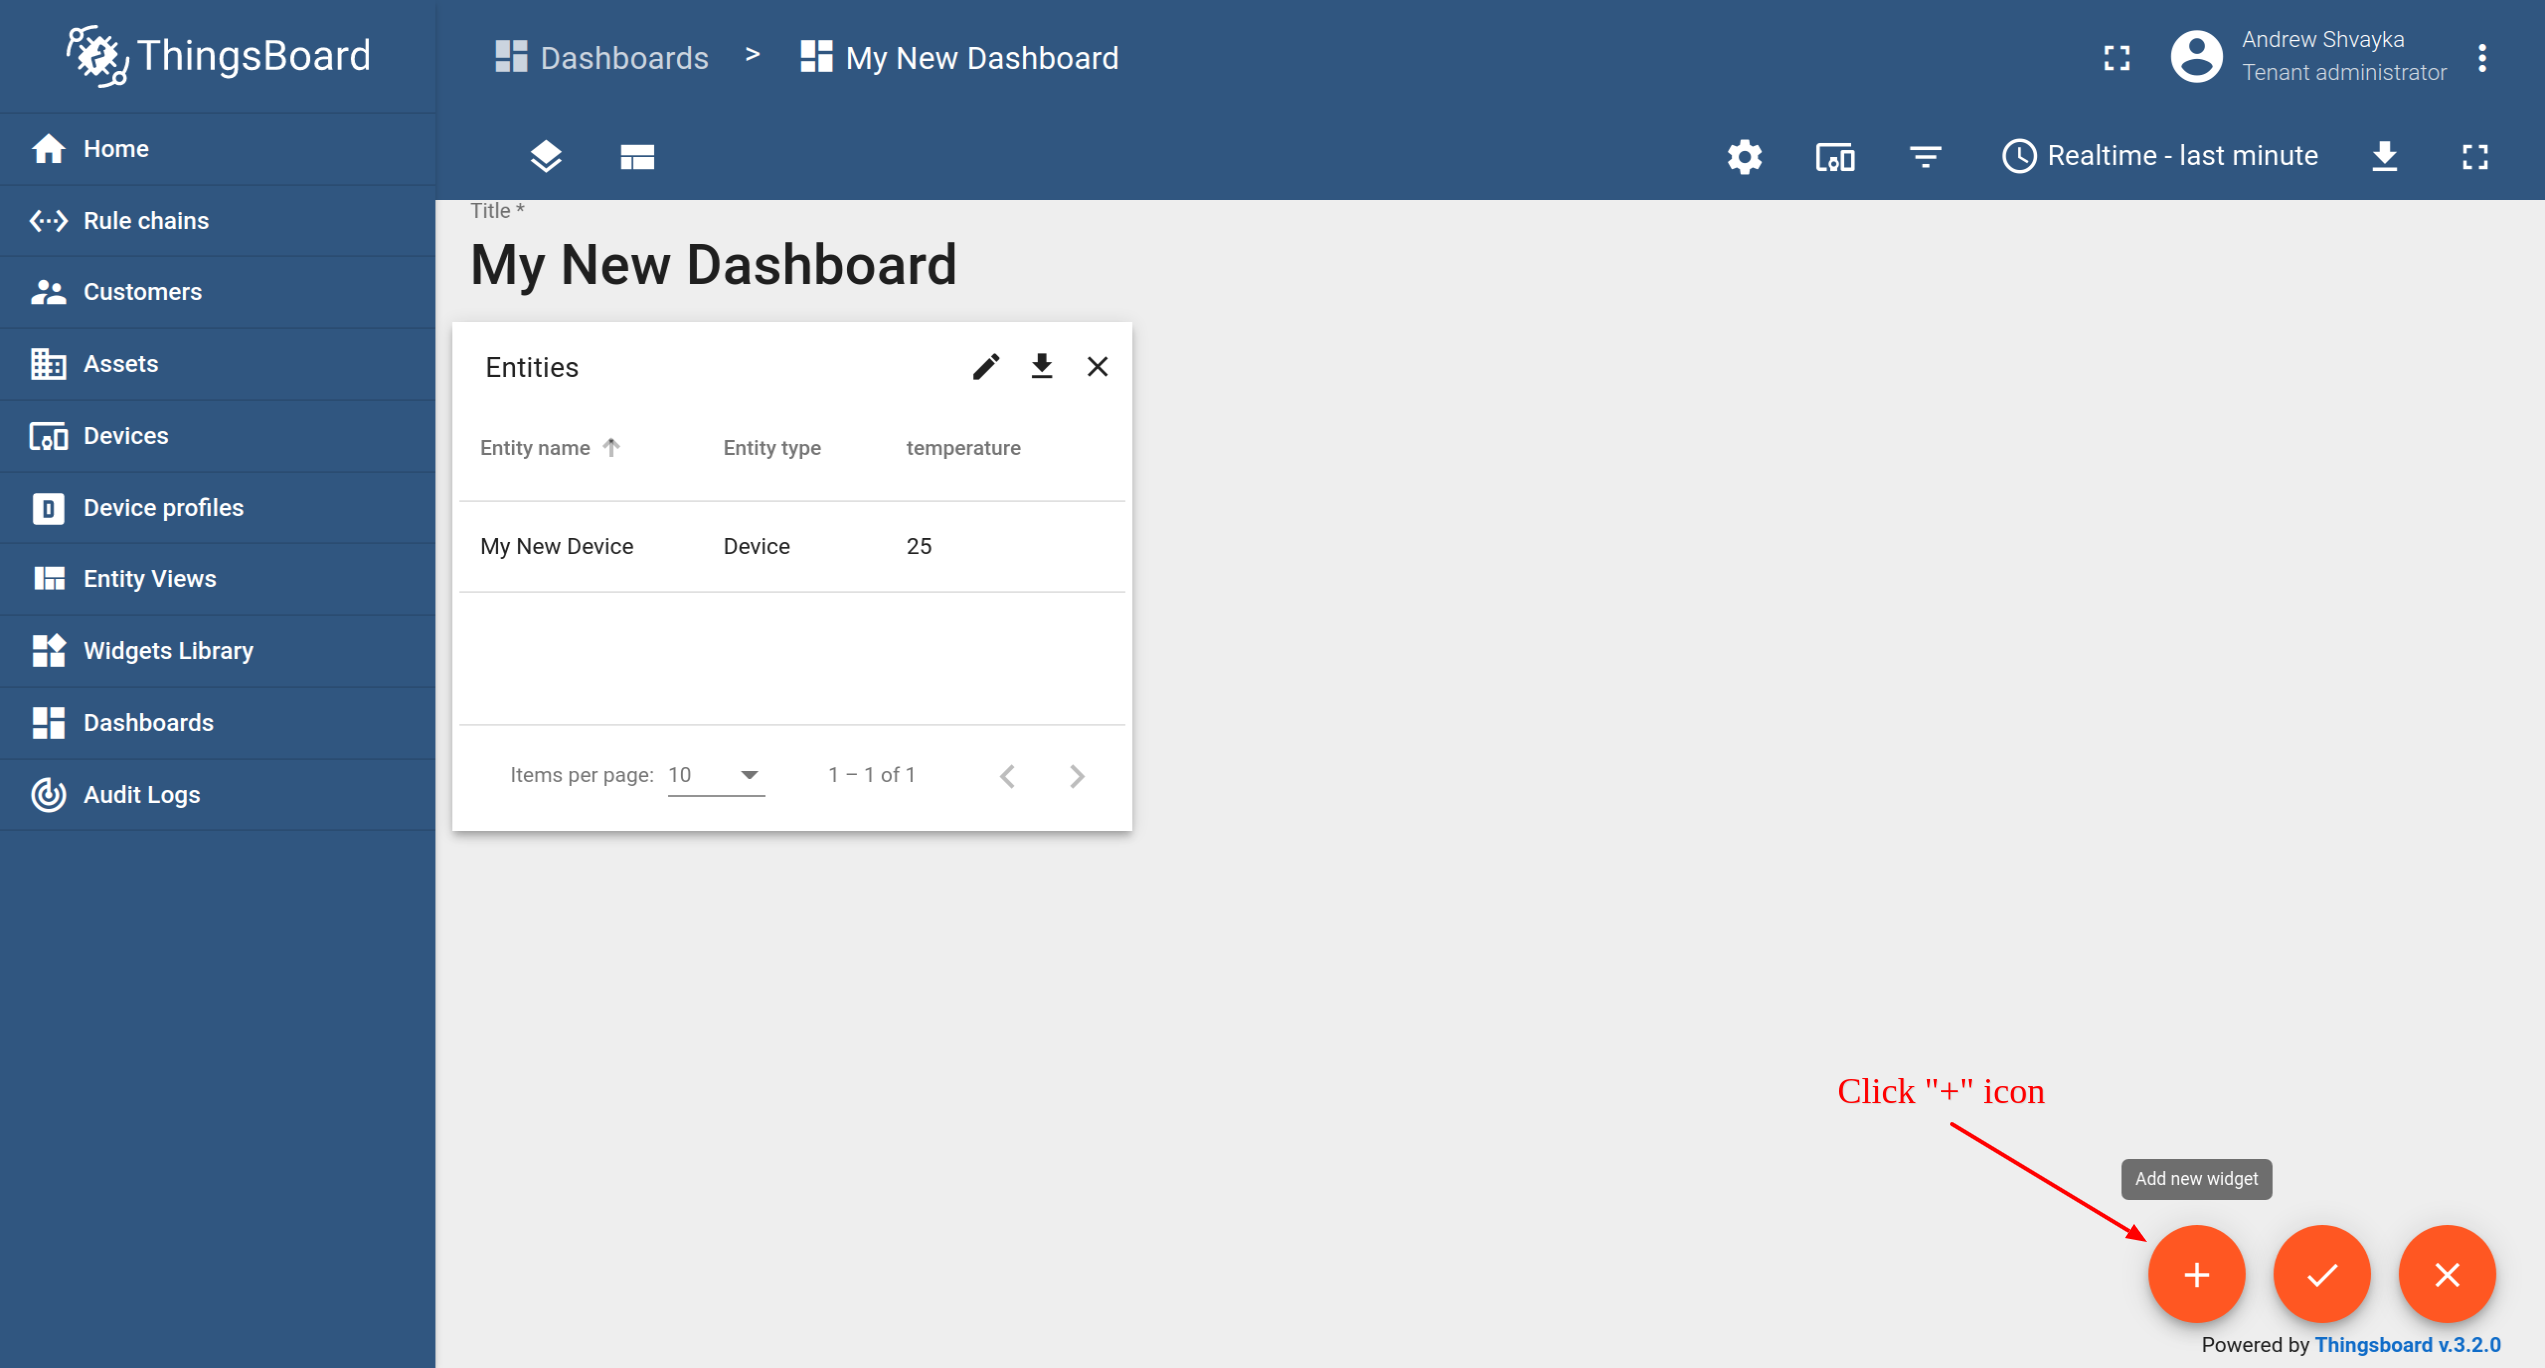
- Click the "Add new widget" icon in the bottom right corner of the screen.
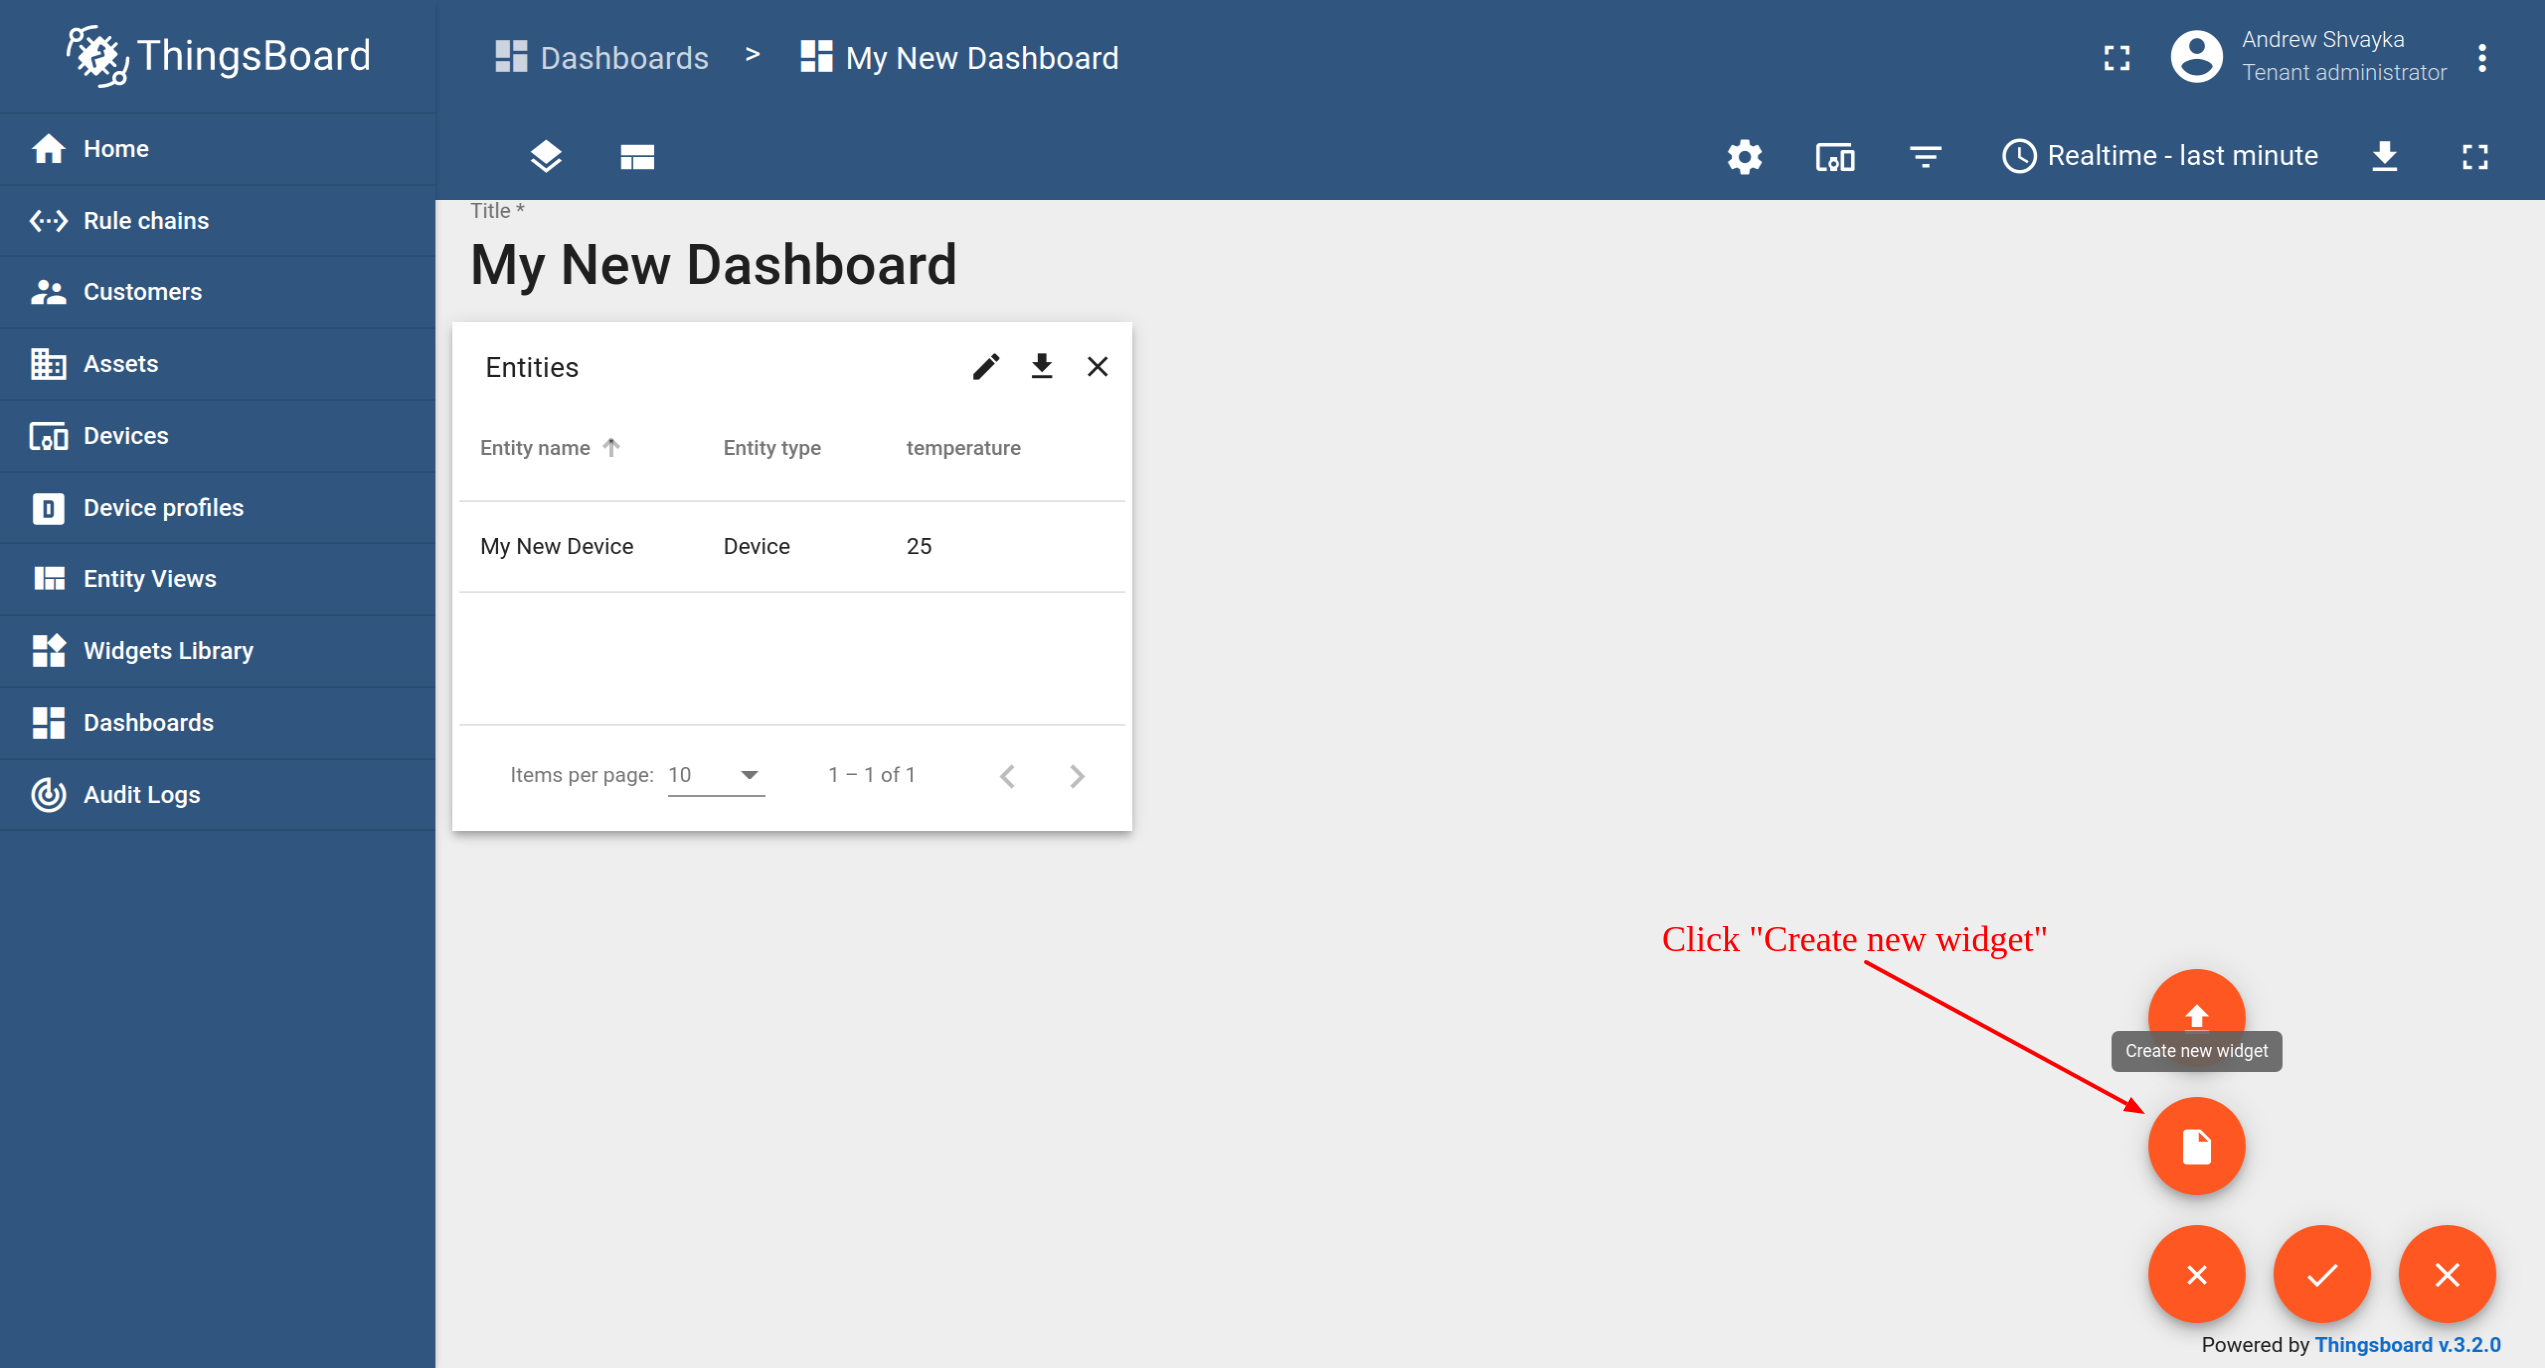
- Click the "Create new widget" icon.
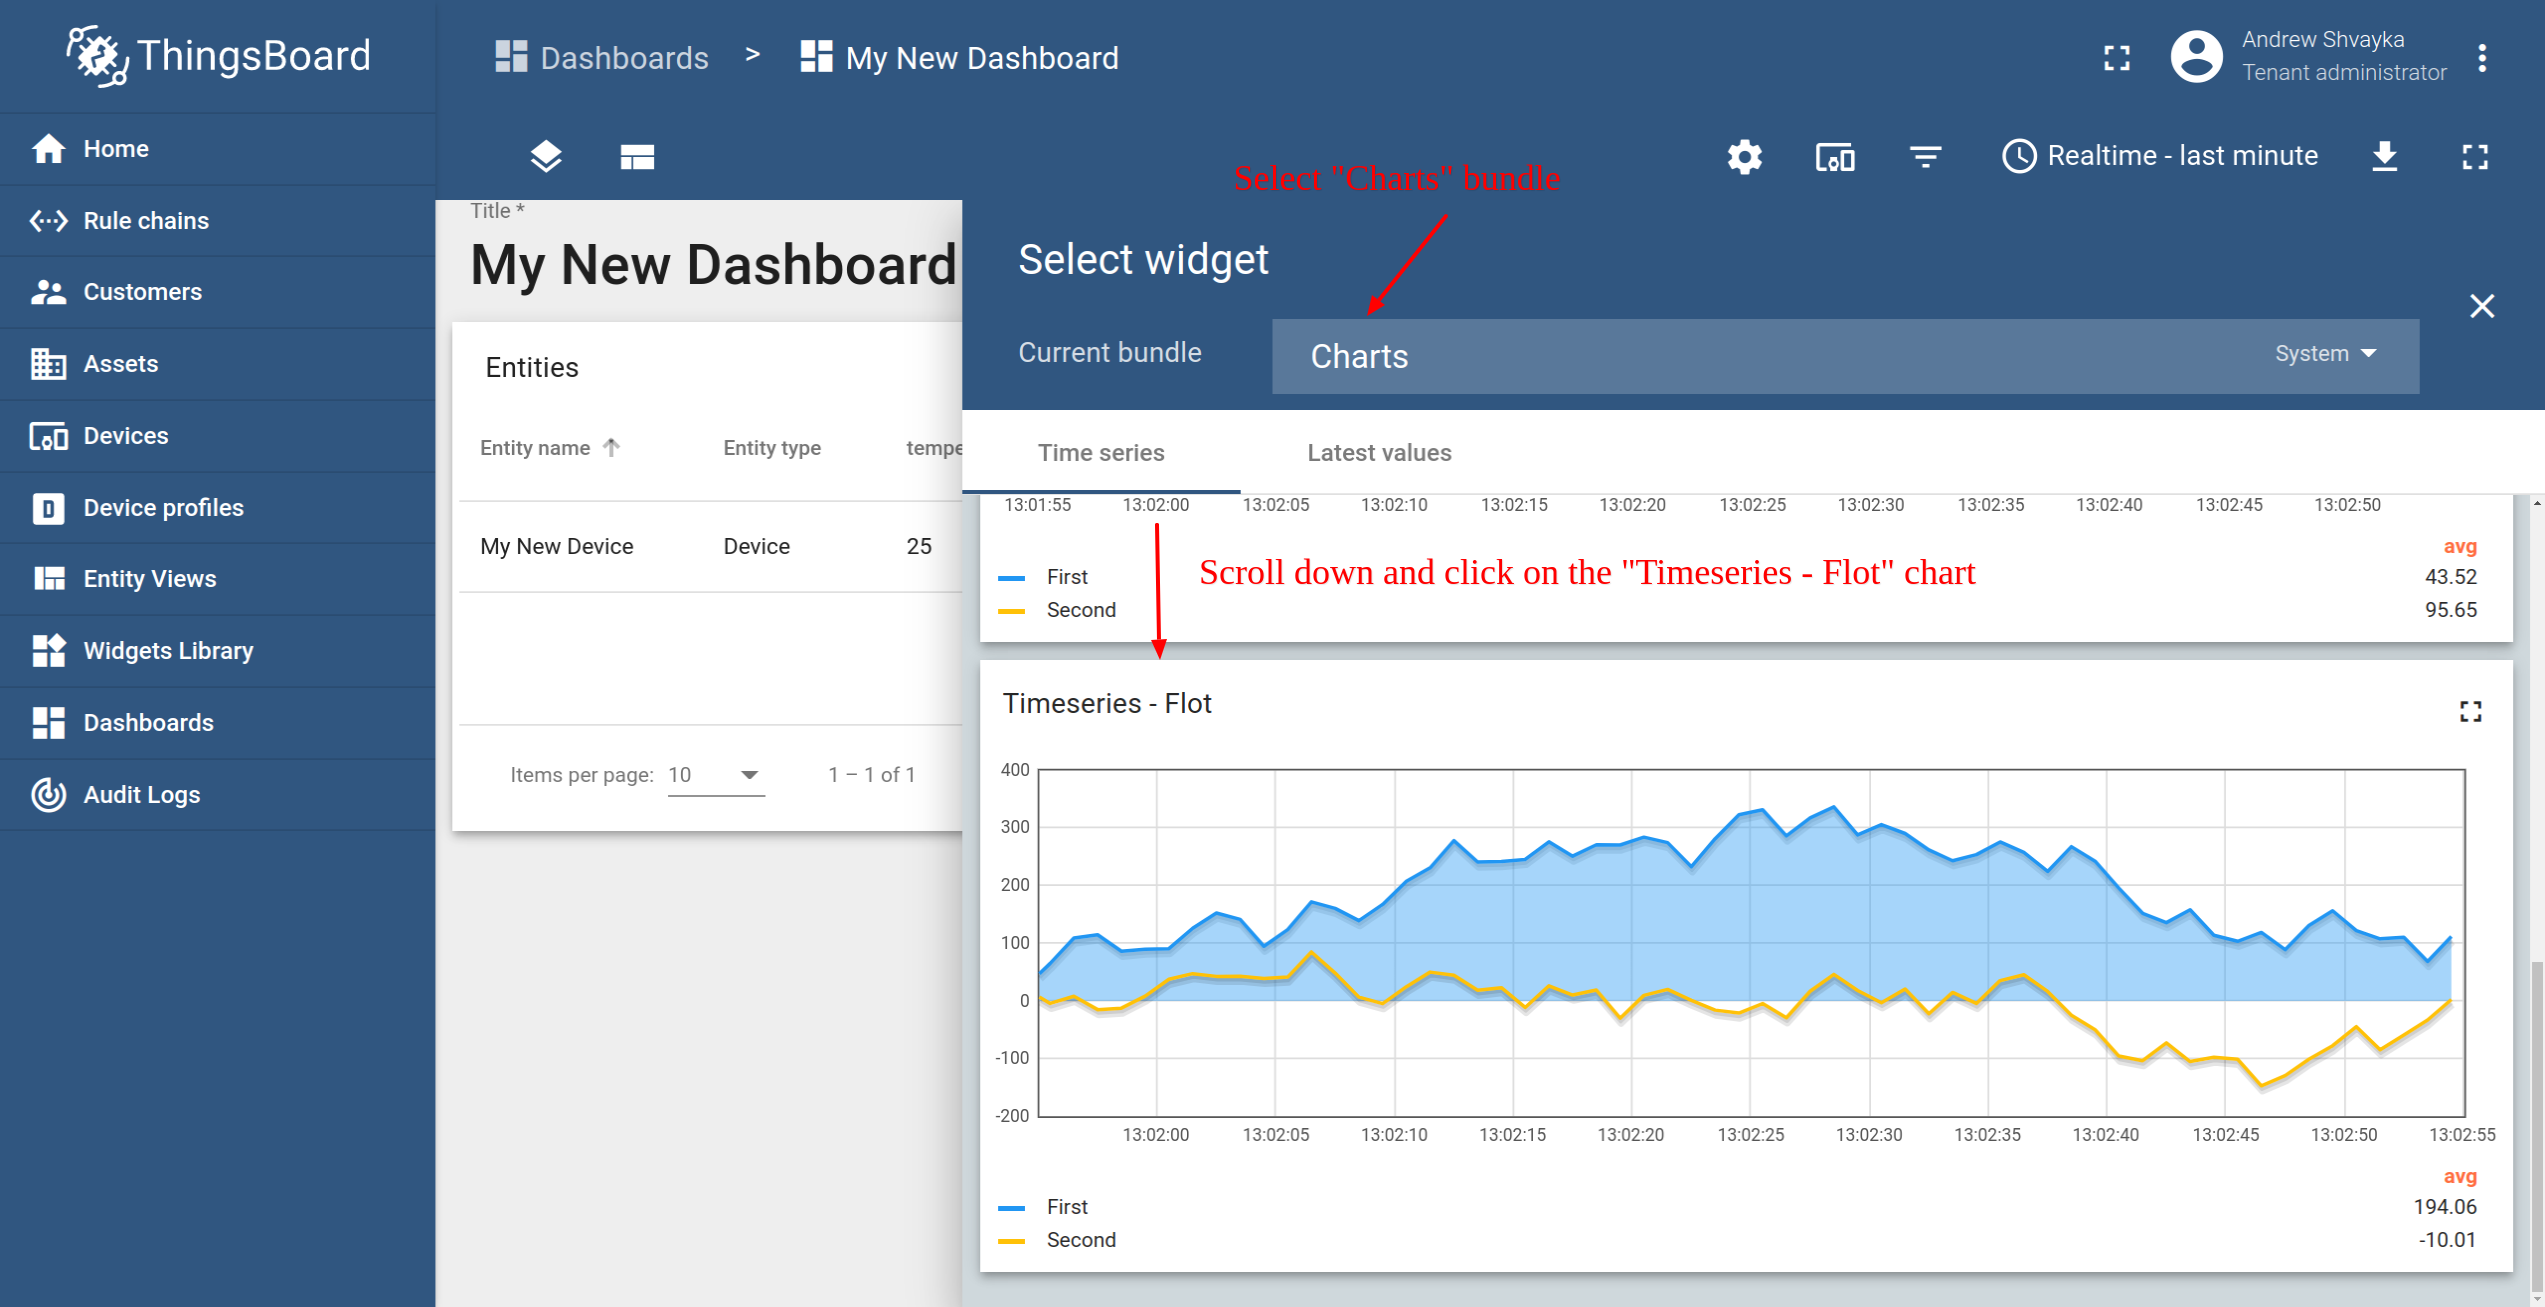
- Select the "Charts" bundle. Scroll down and click on the "Timeseries - Flot" chart widget.
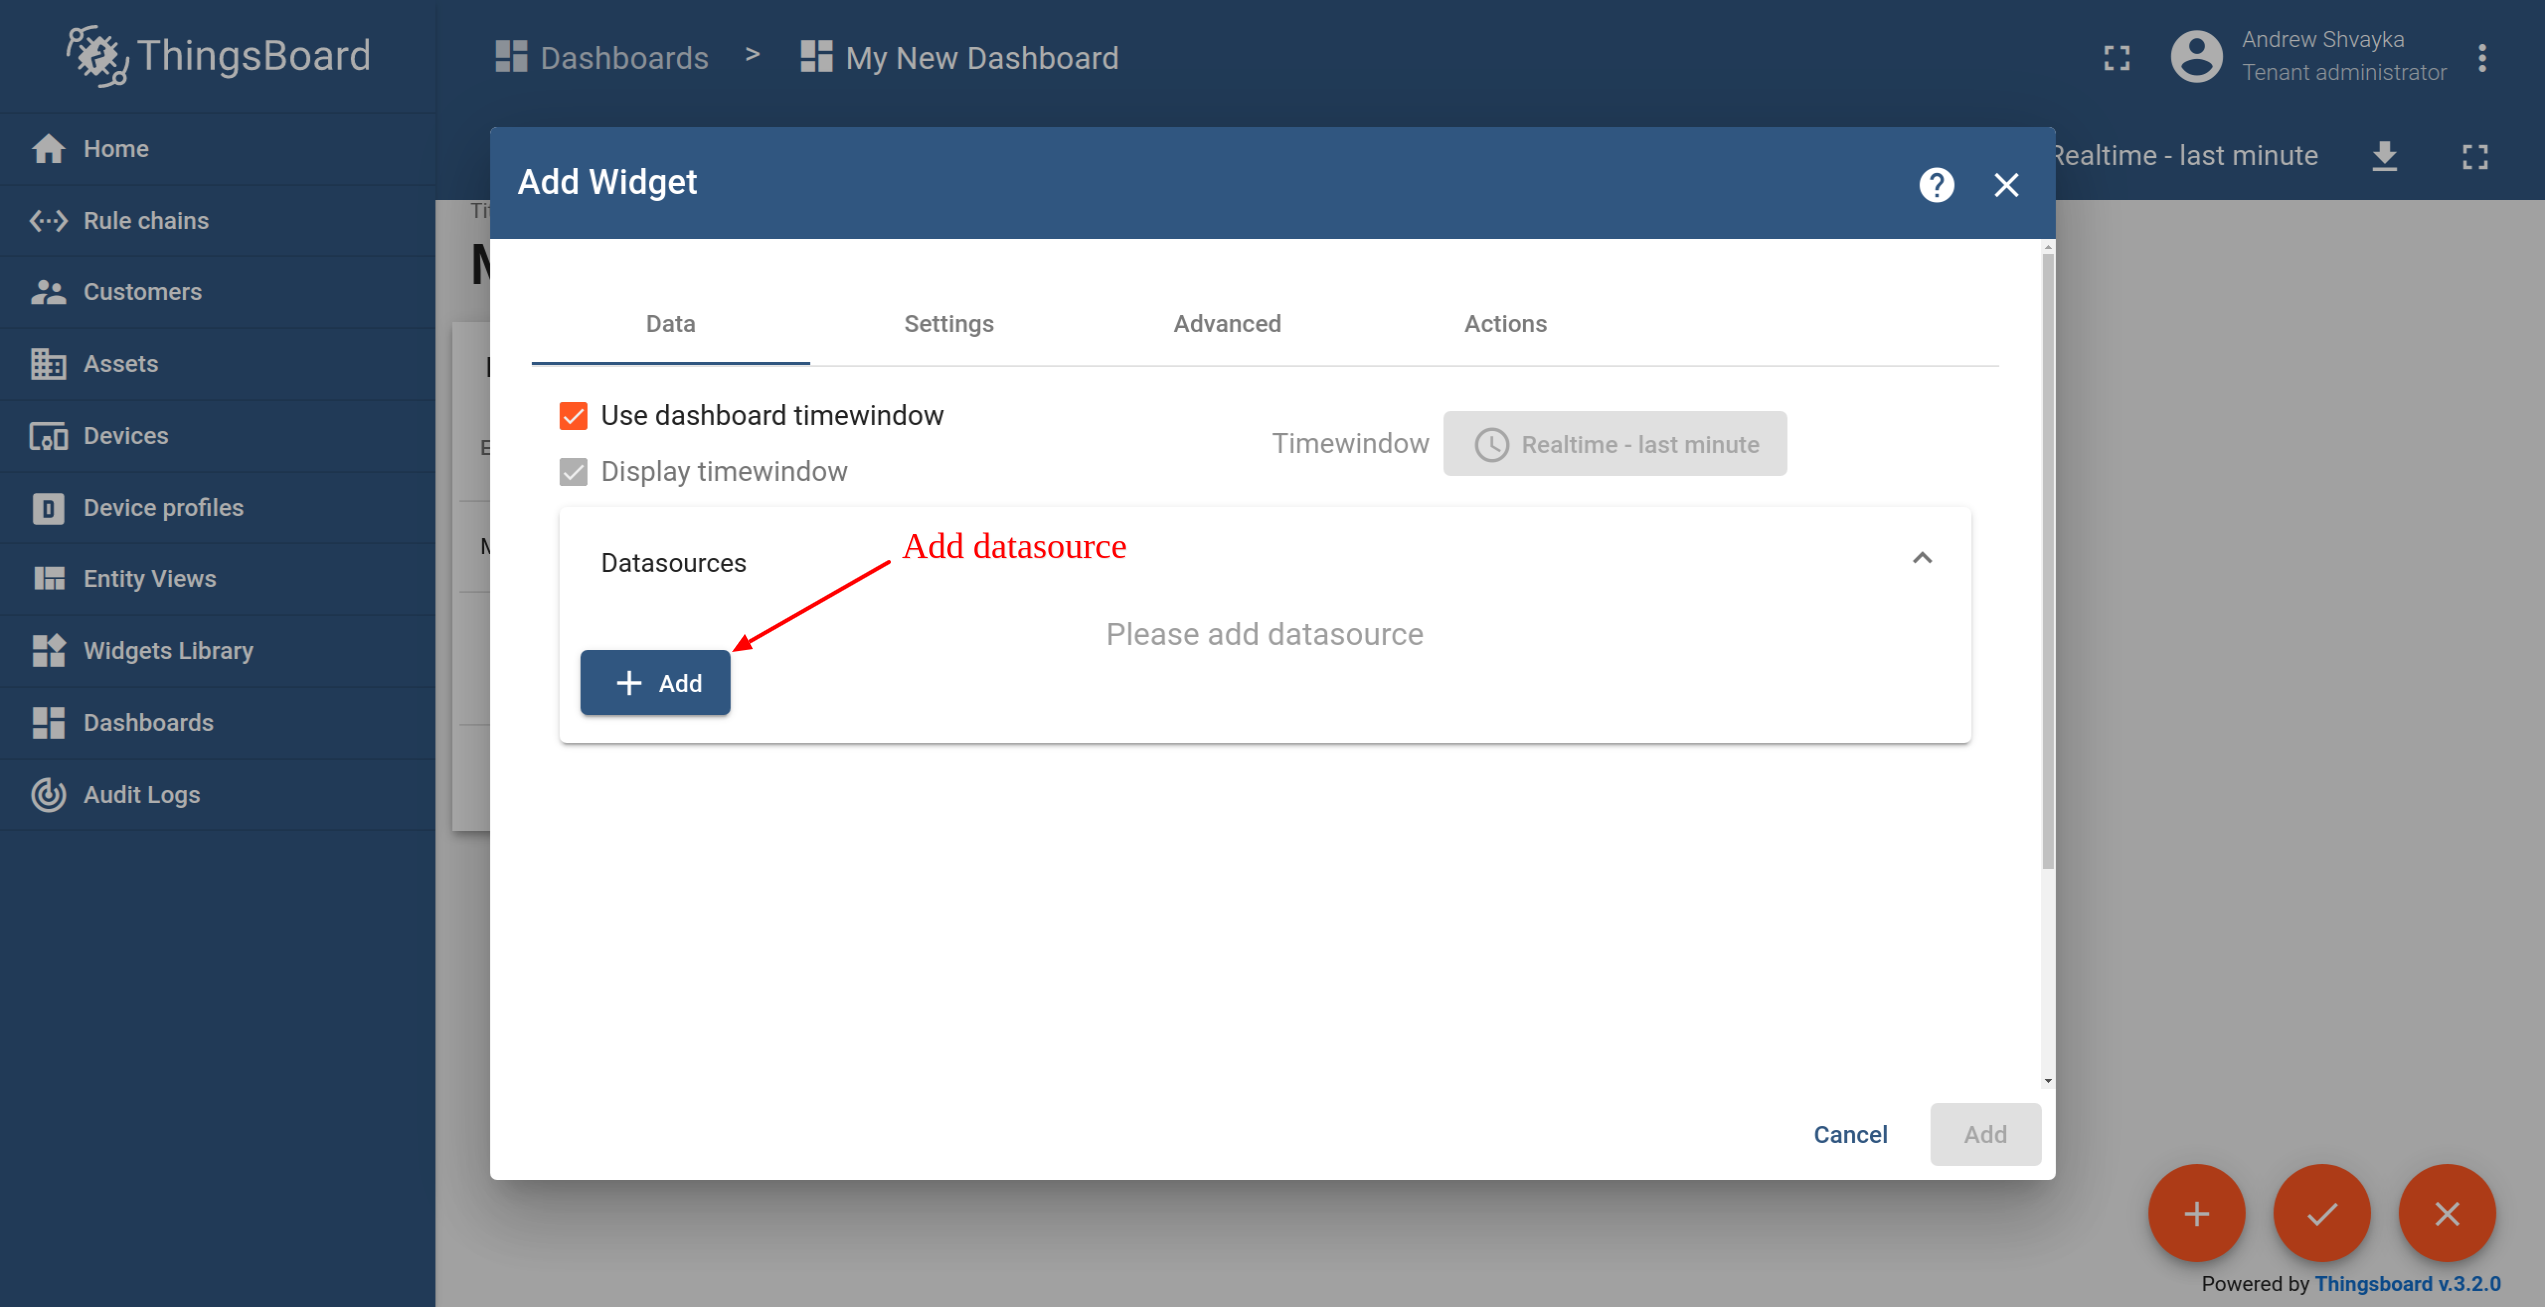
- Click the "Add Datasource" button.
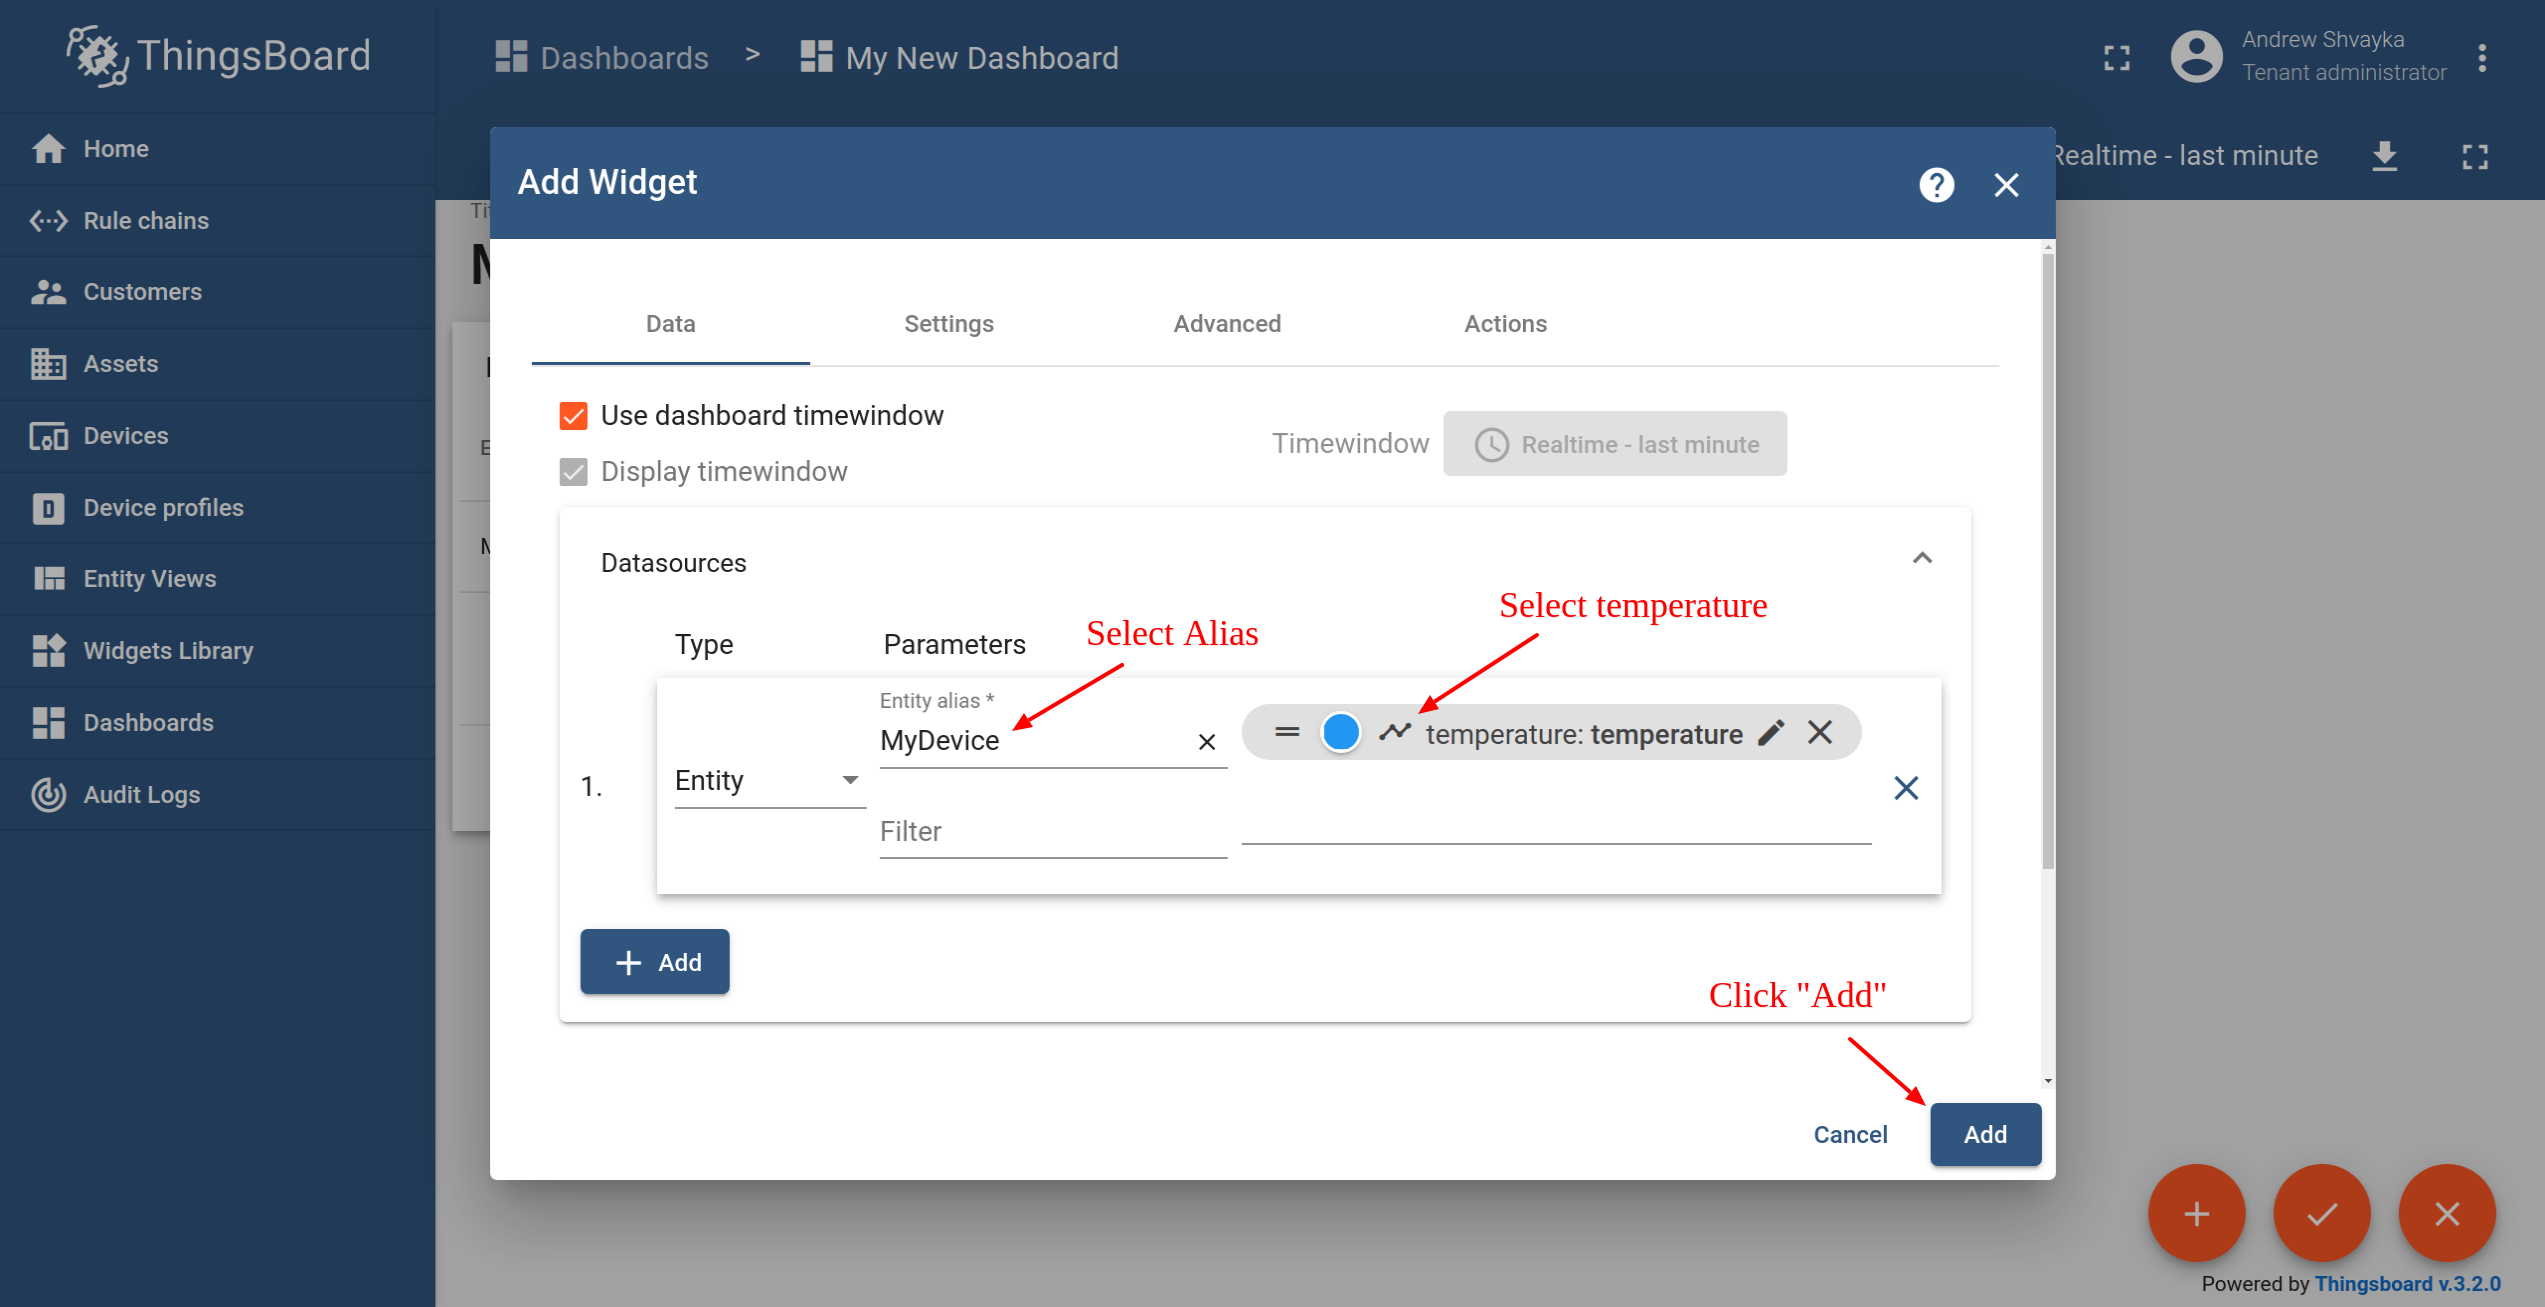
- Select "MyDevice" Alias. Select the "temperature" key. Click "Add".
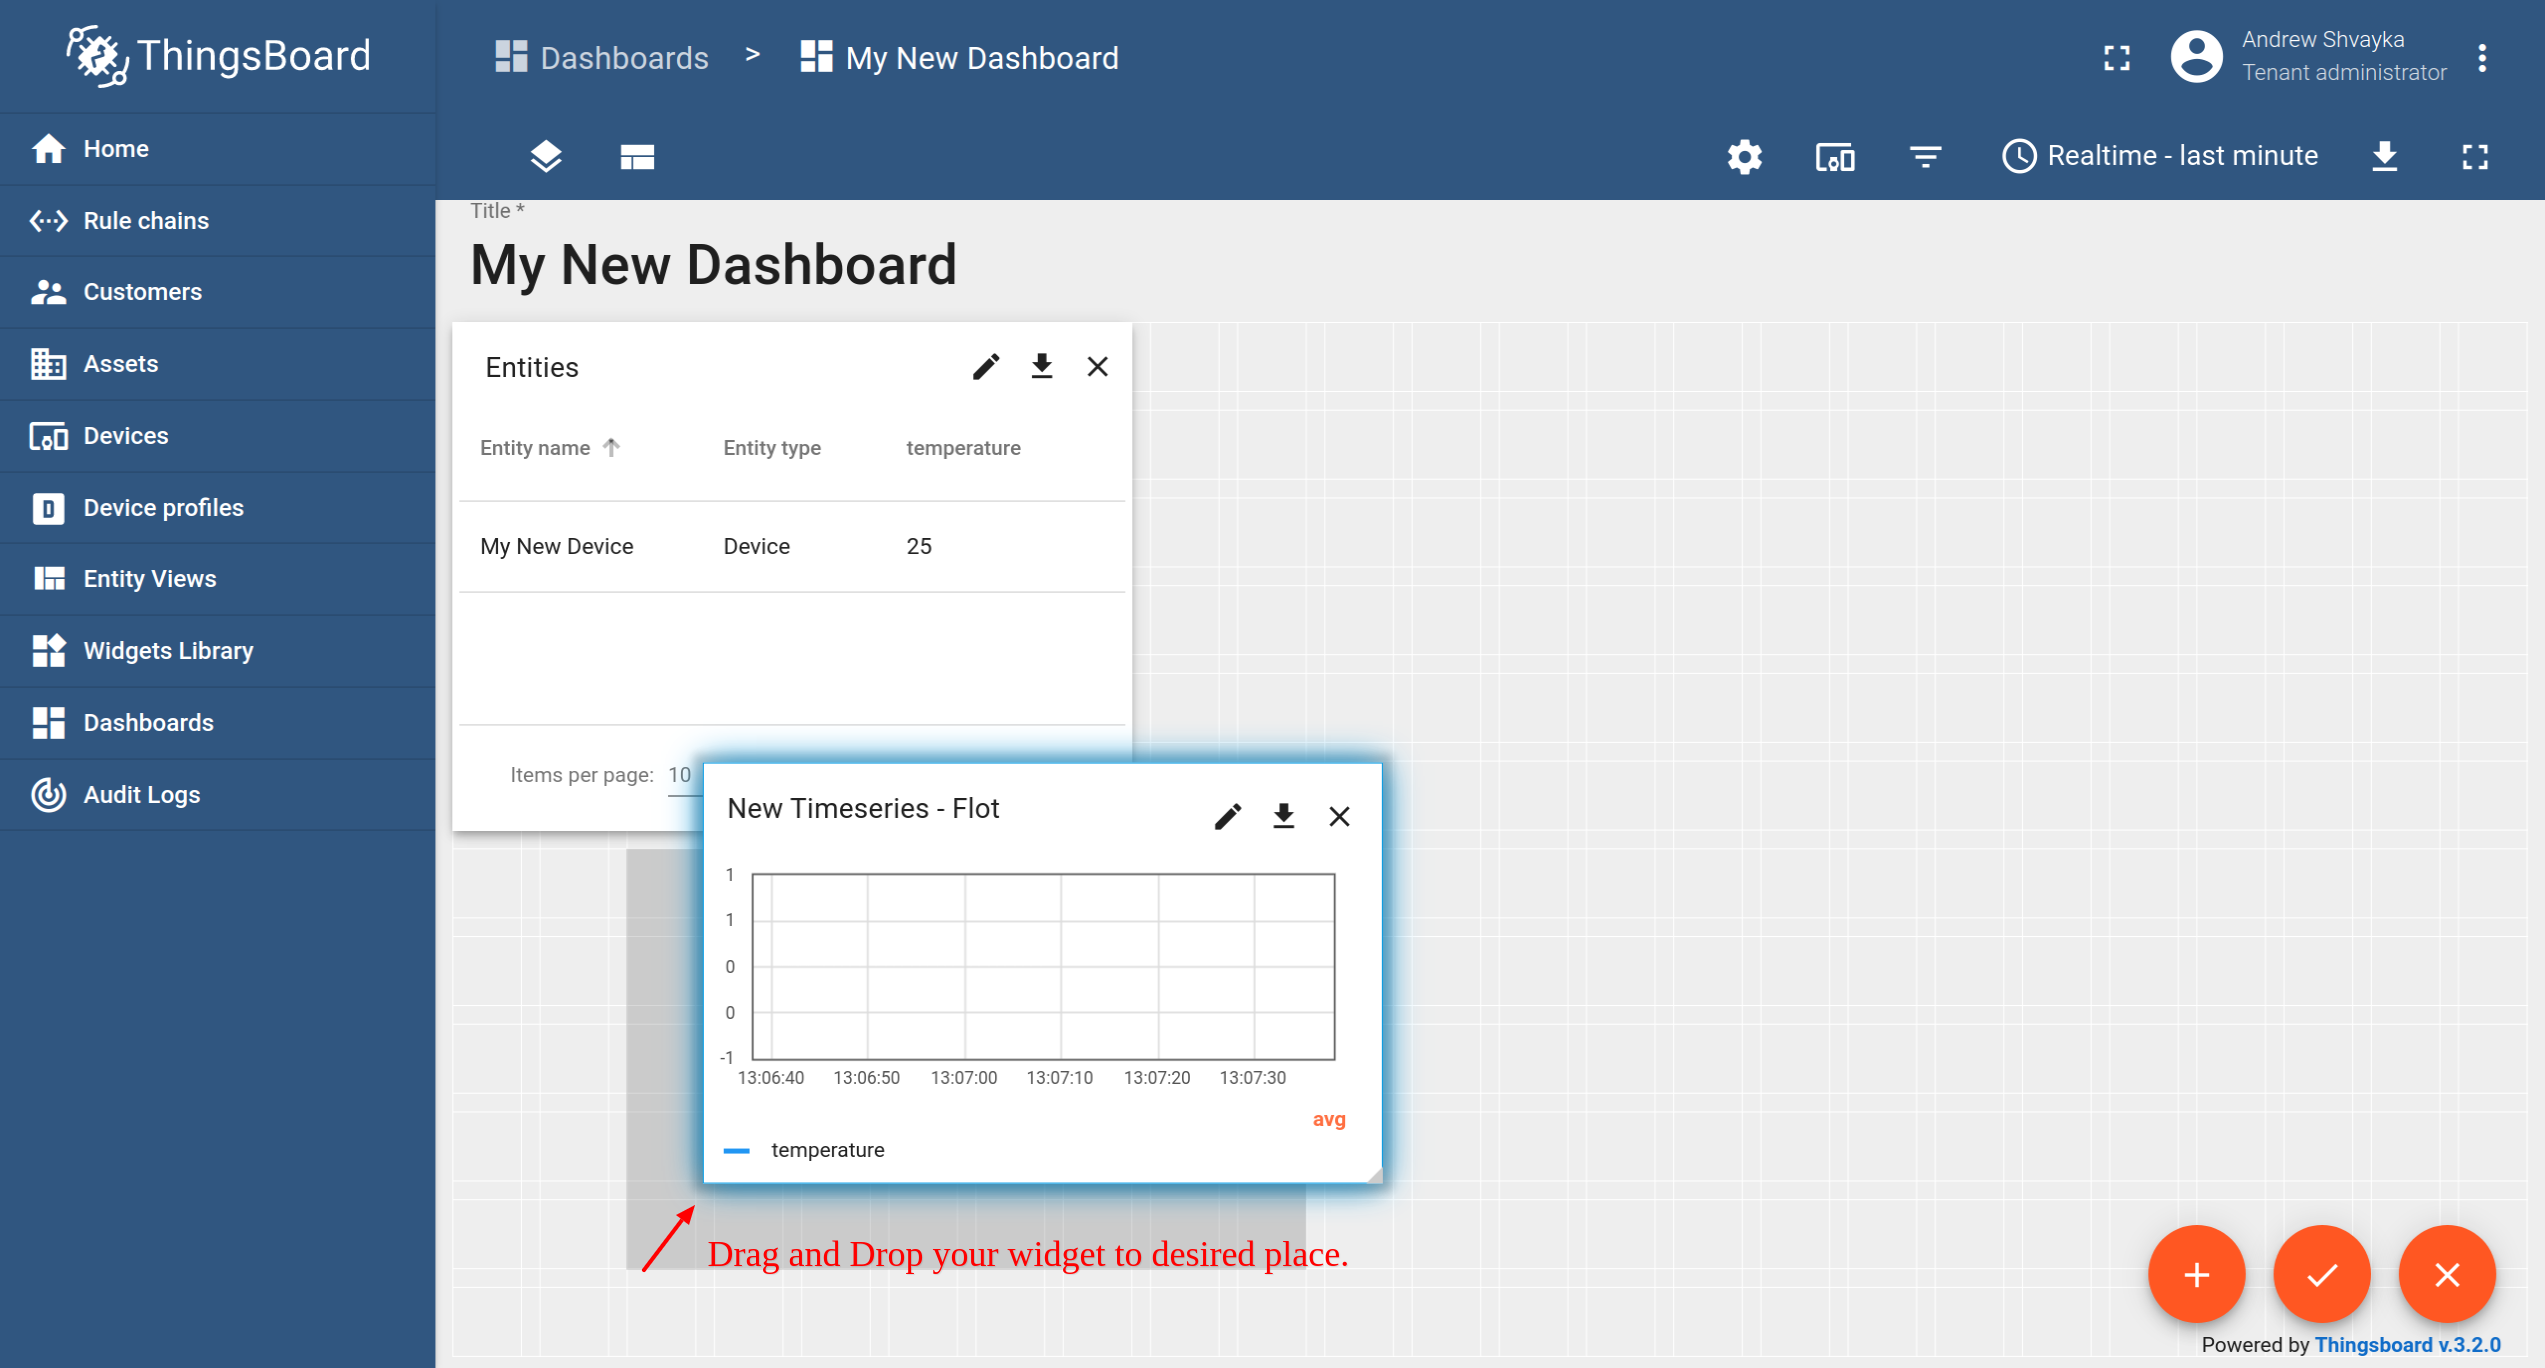
- Drag and Drop your widget to the desired space. Resize the widget. Apply changes.
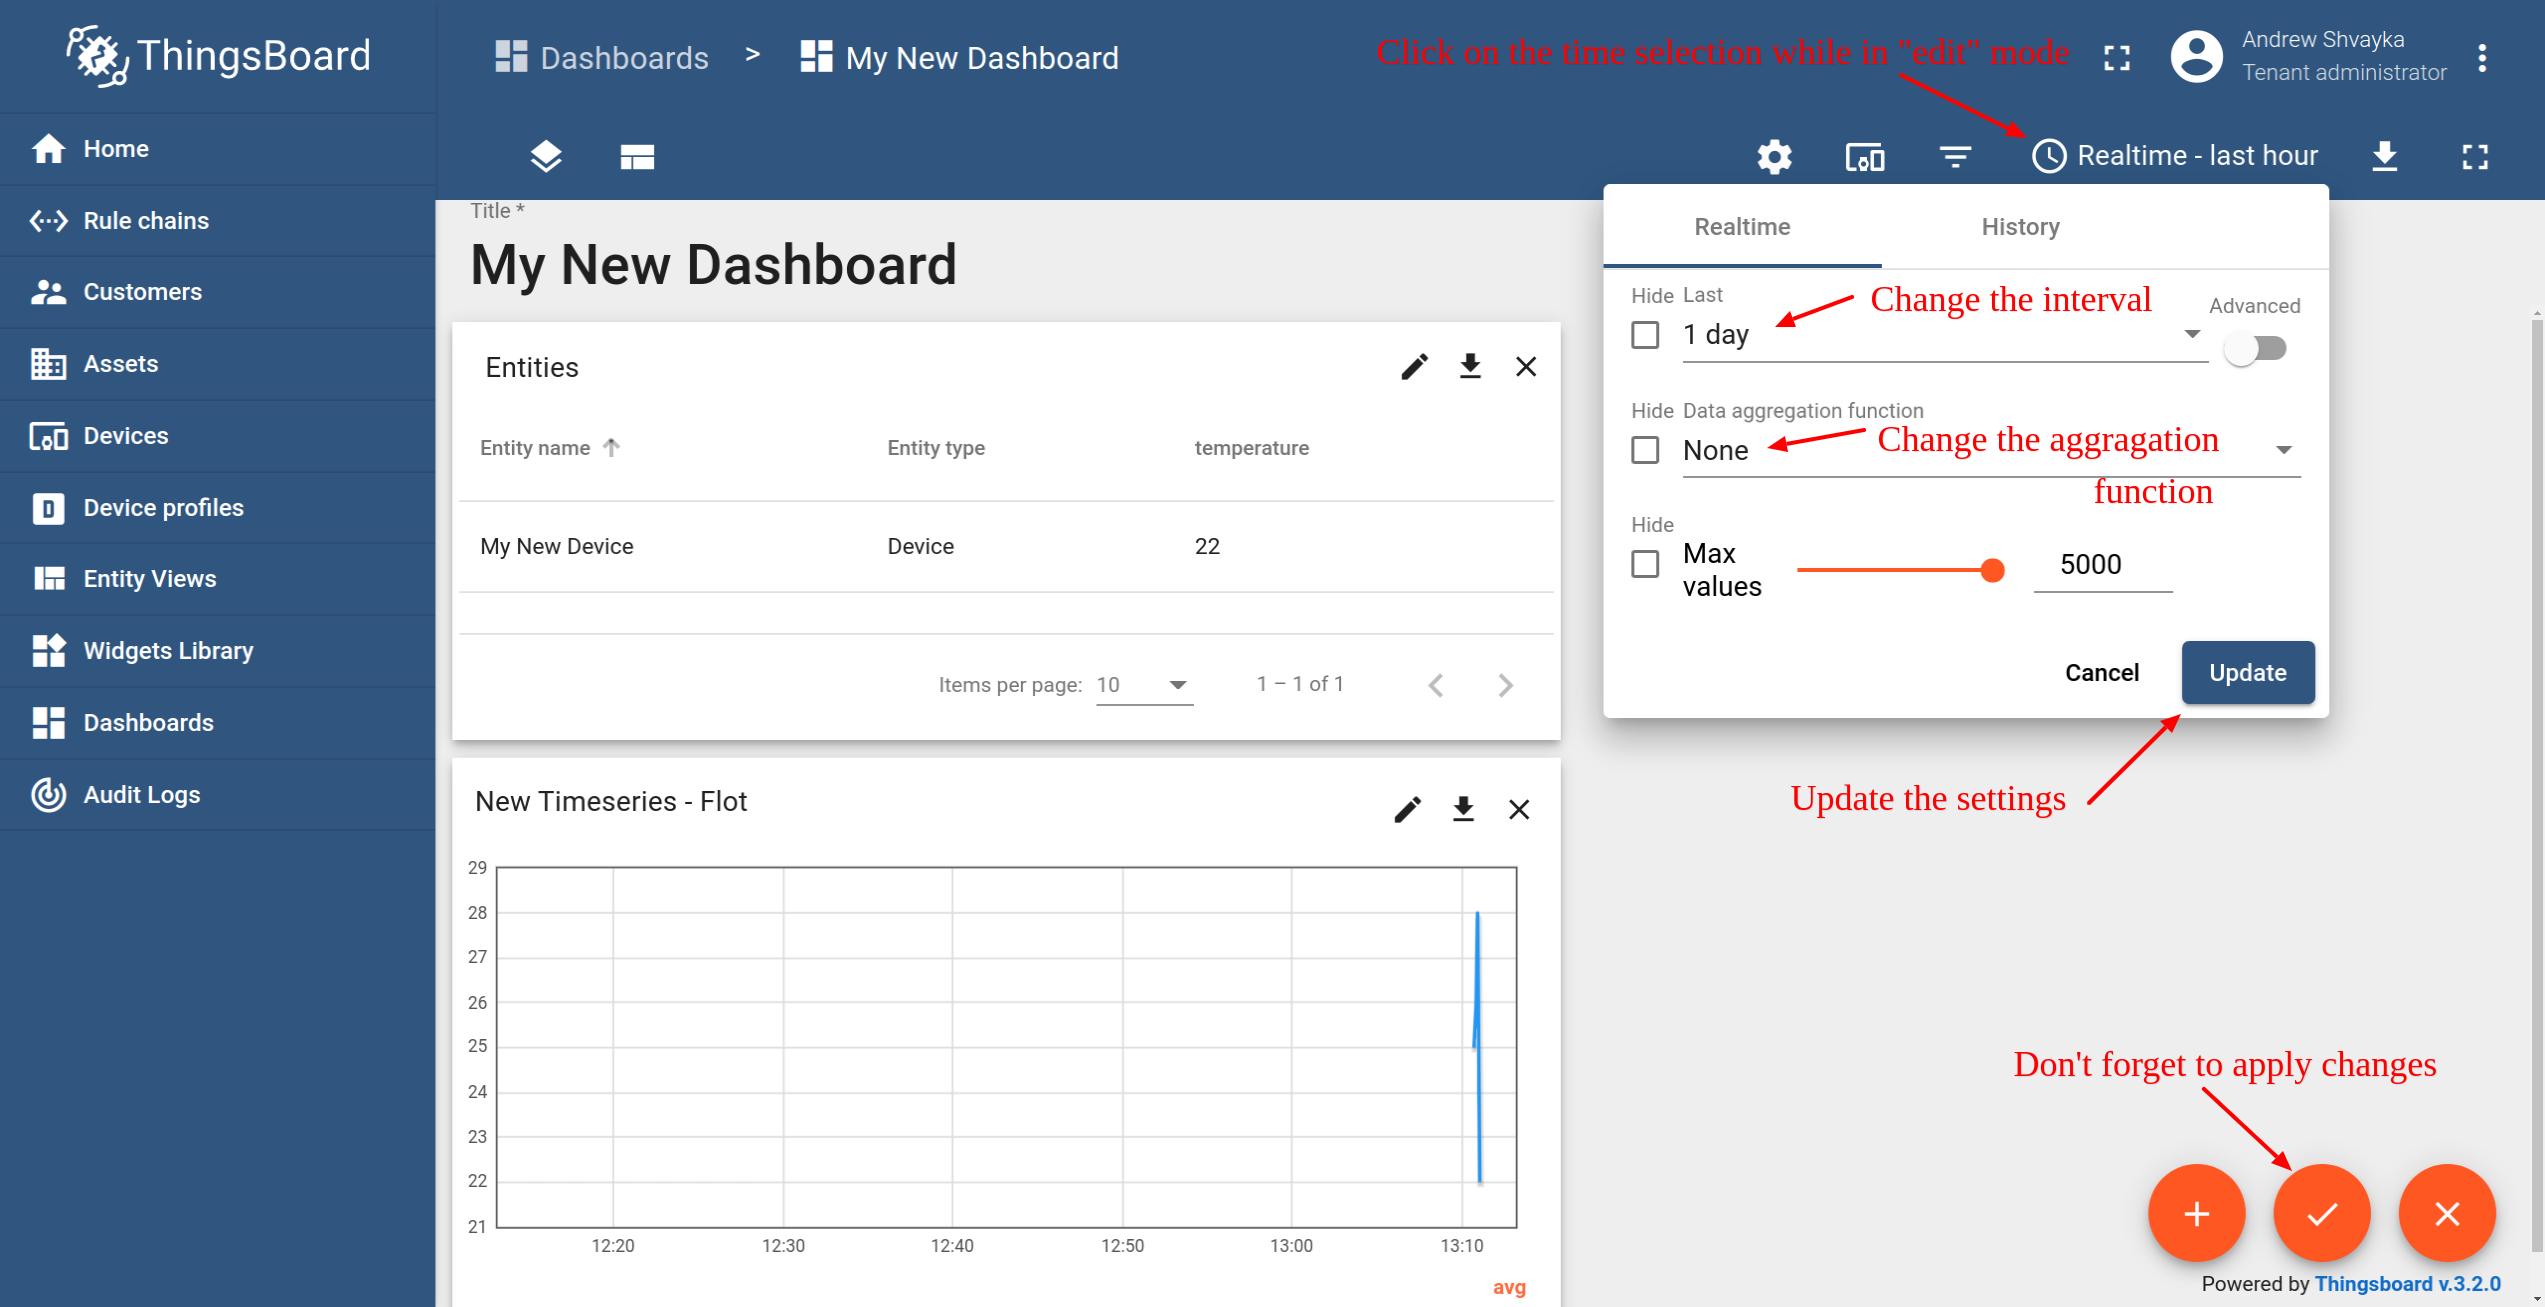
- Publique diferentes valores de telemetria várias vezes Etapa 2. Observe que o widget exibe apenas um minuto de dados por padrão.
- Entre no modo de edição. Abra a janela de seleção de tempo. Altere o intervalo e a função de agregação. Atualize a janela de tempo e aplique as alterações.
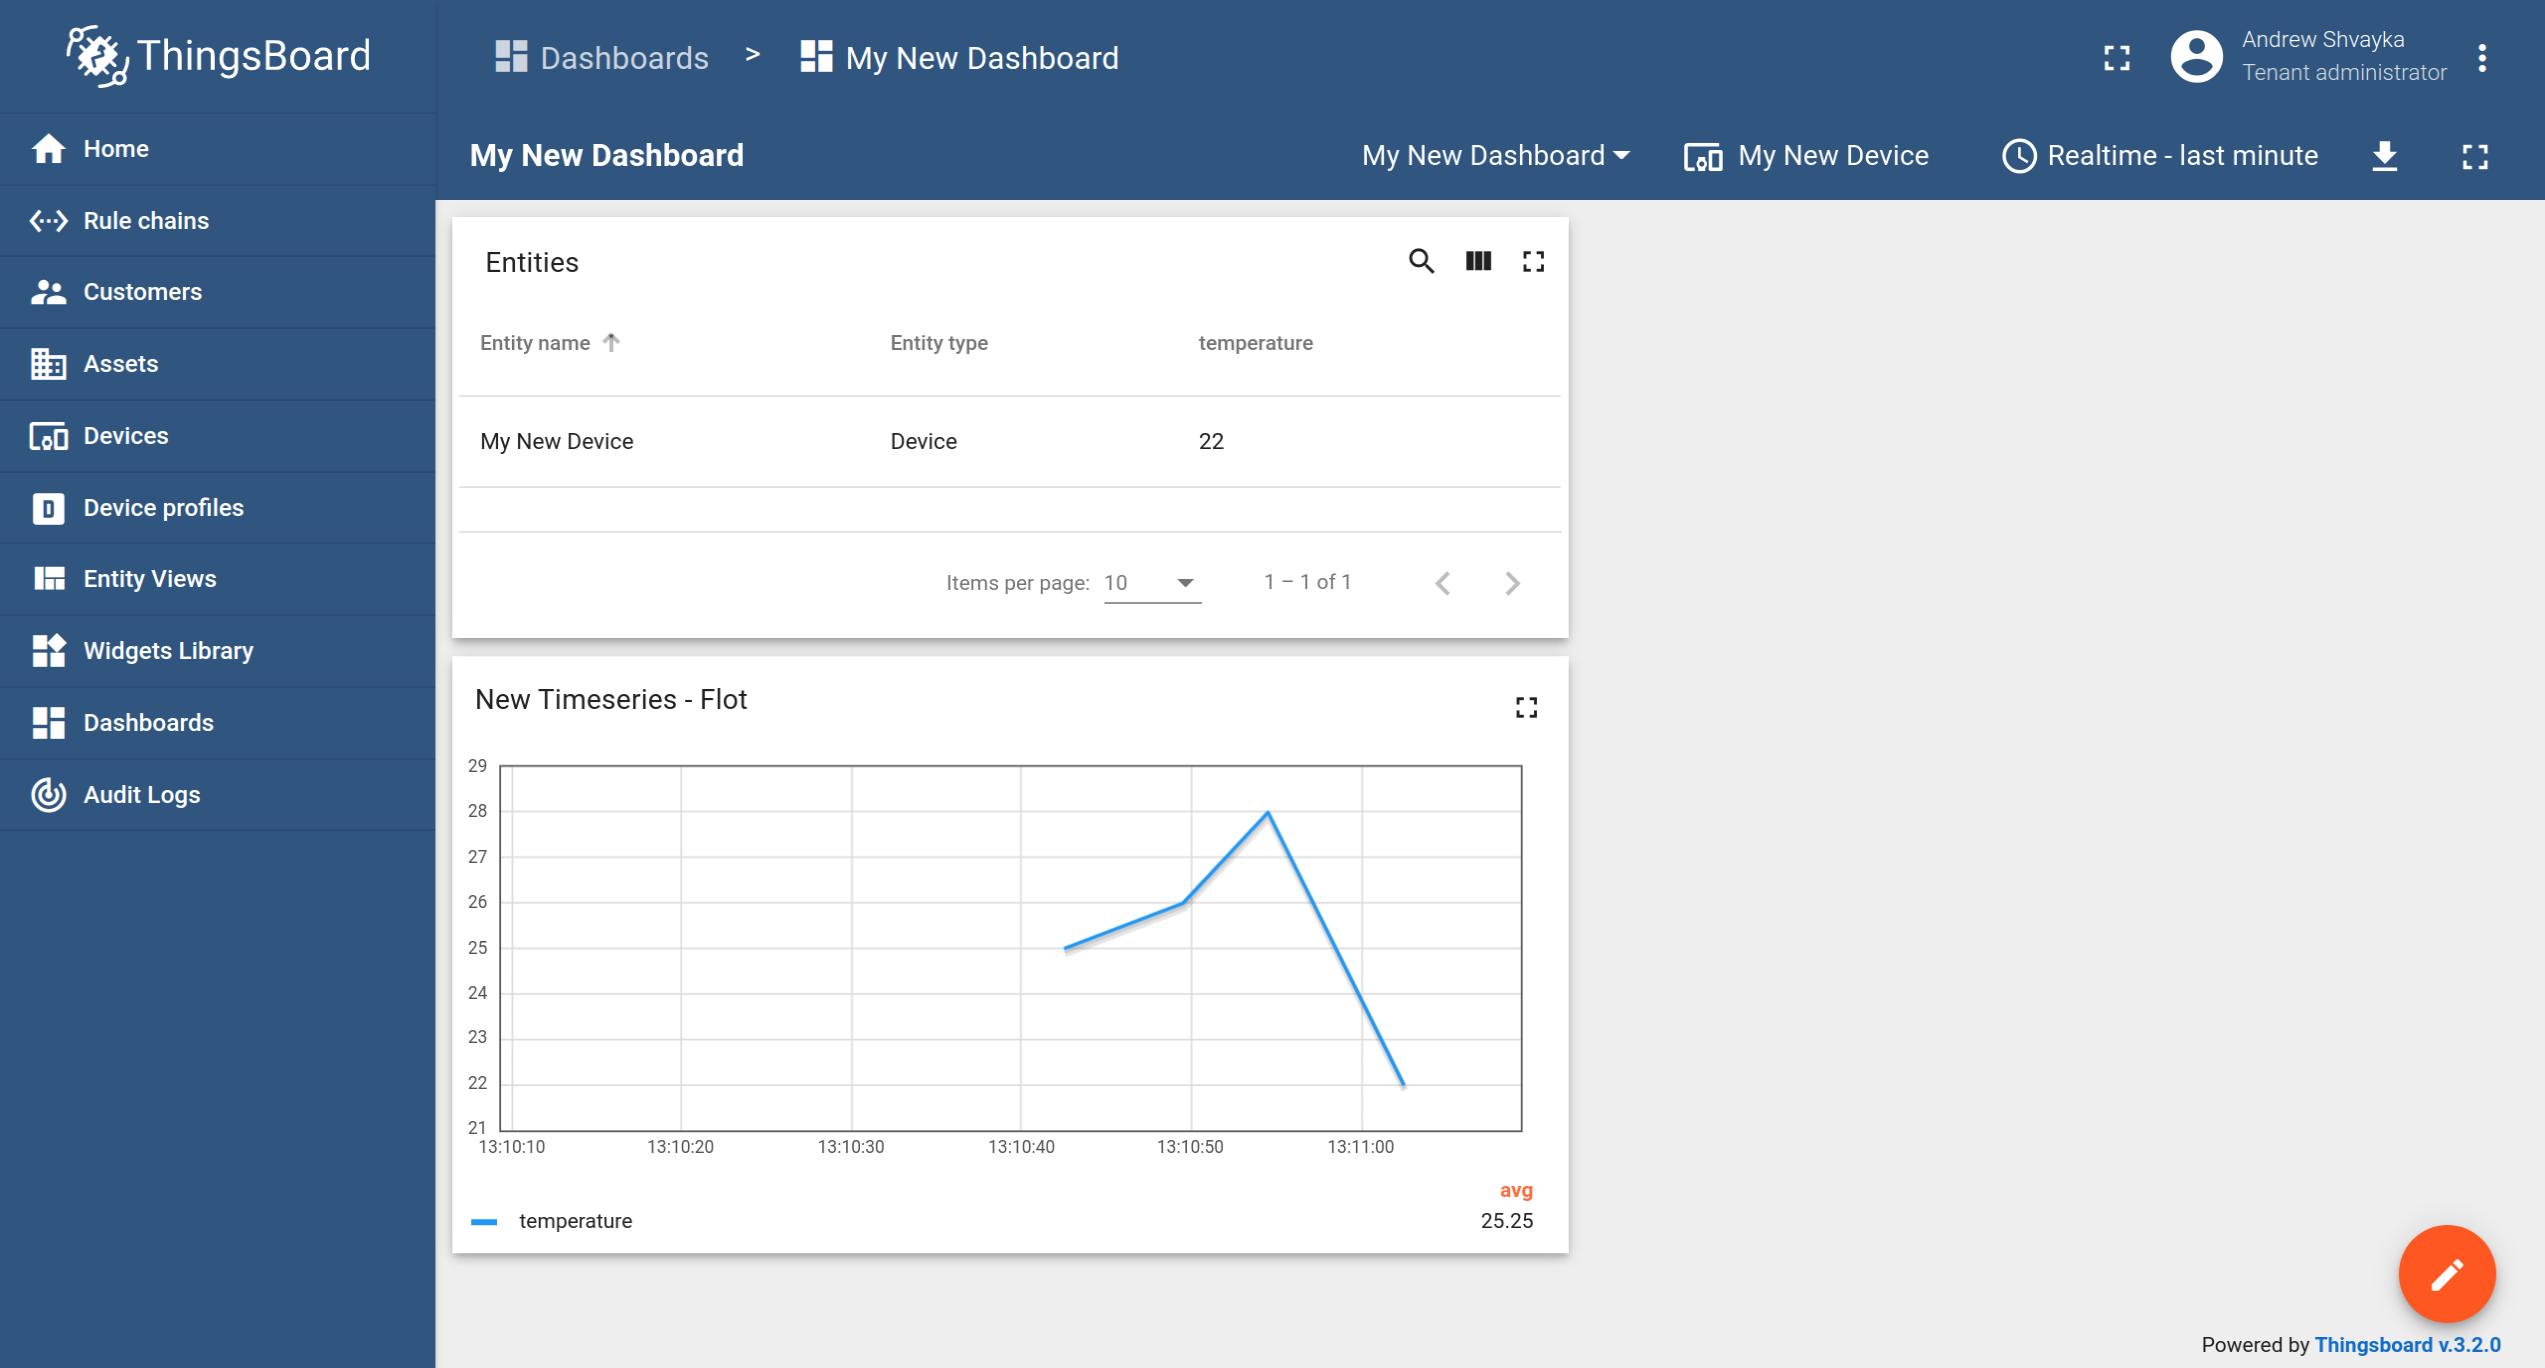
Congratulations! You have added a chart widget. Now you can send new telemetry reading and it will immediately appear in the chart.
Passo 3.5: Adicionar um widget de alarme
- Entre no modo de edição.
- Click the "Add new widget" icon in the bottom right corner of the screen.
- Click the "Create new widget" icon.
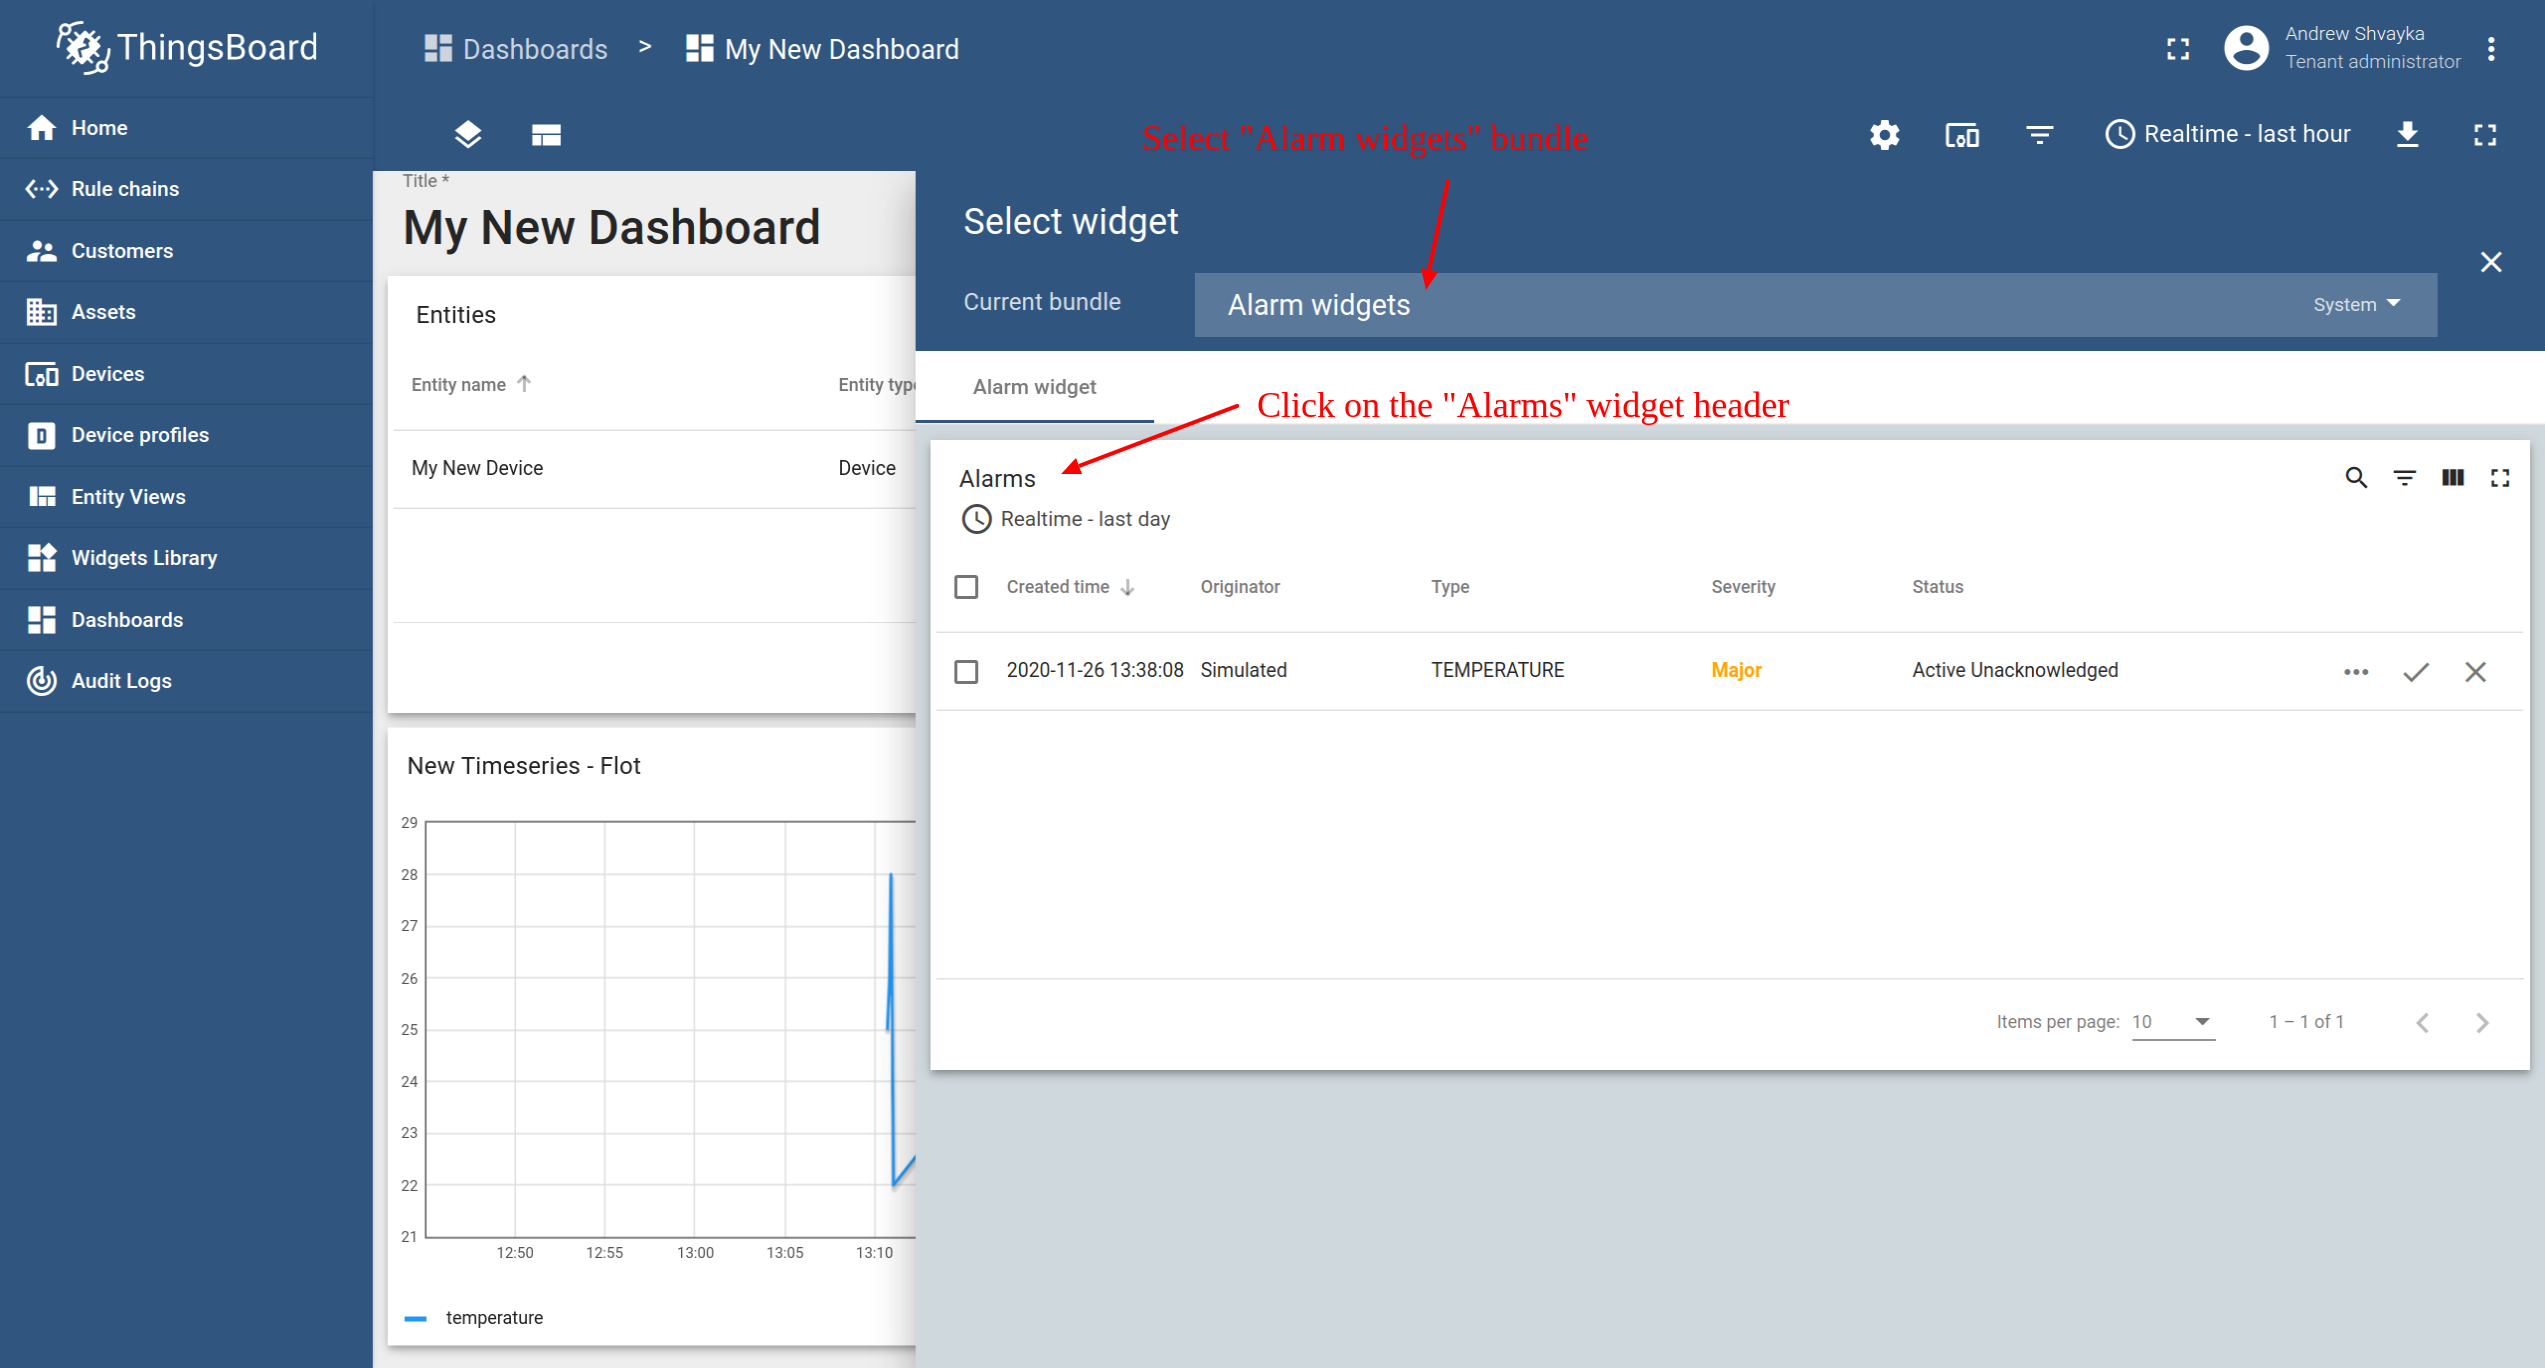
- Select the "Alarm widgets" bundle. Click on the "Alarms" widget header.
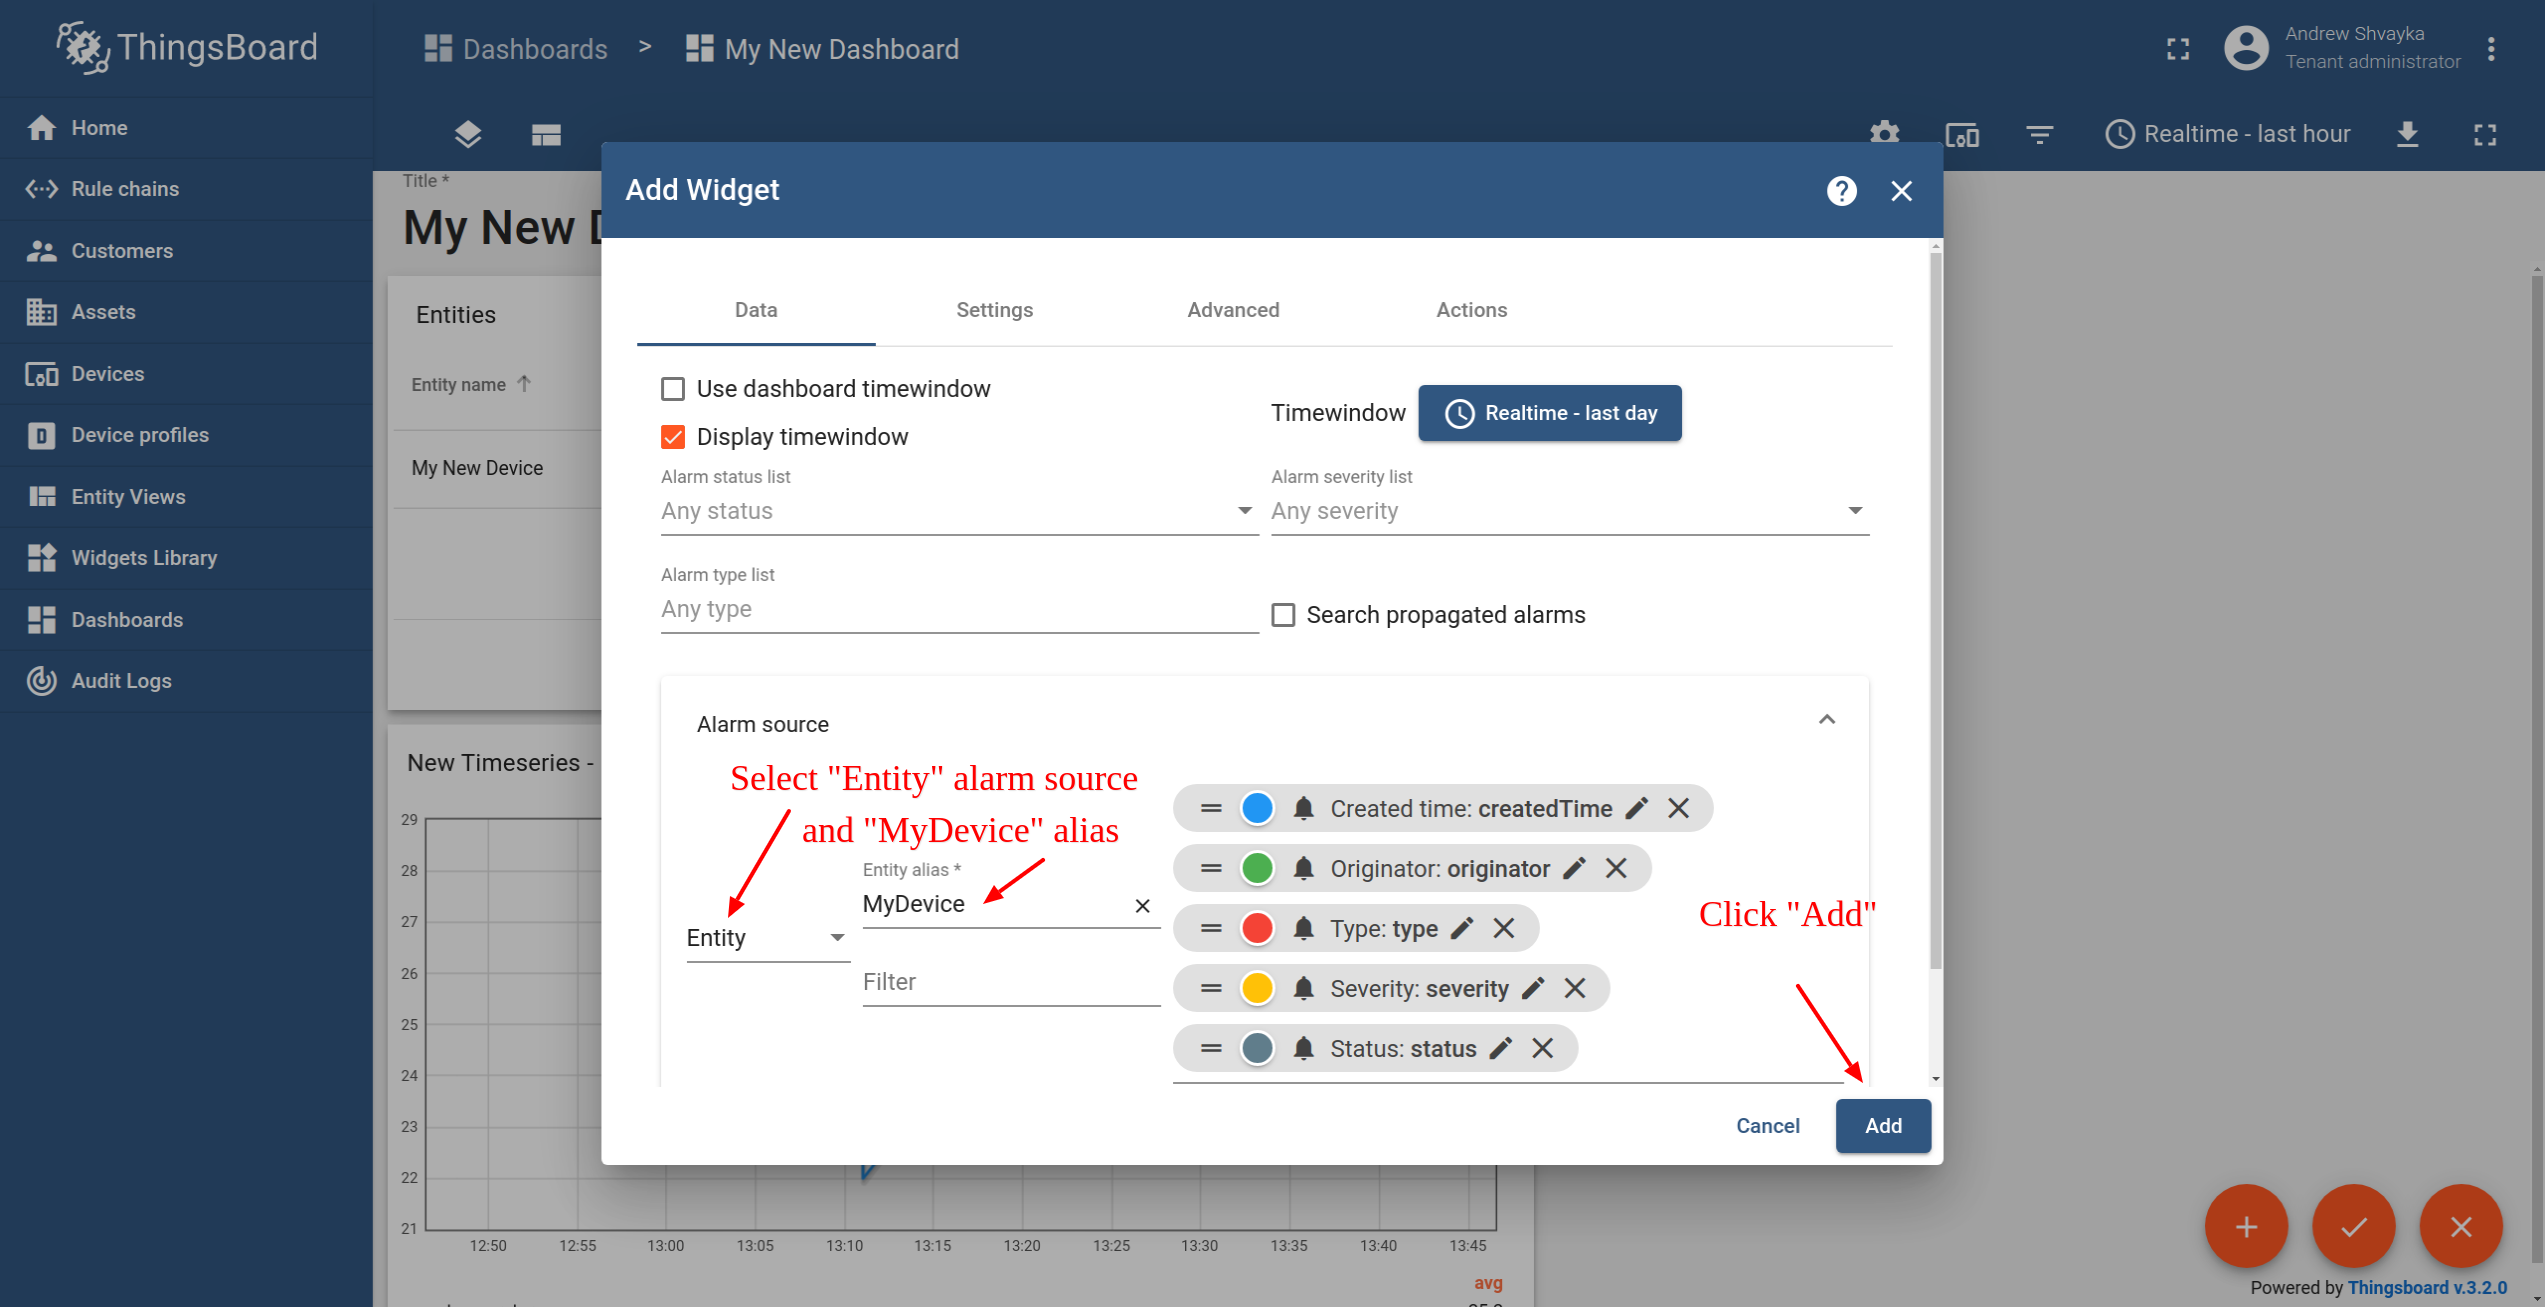
- Select the "Entity" alarm source and "MyDevice" alias. Click "Add"
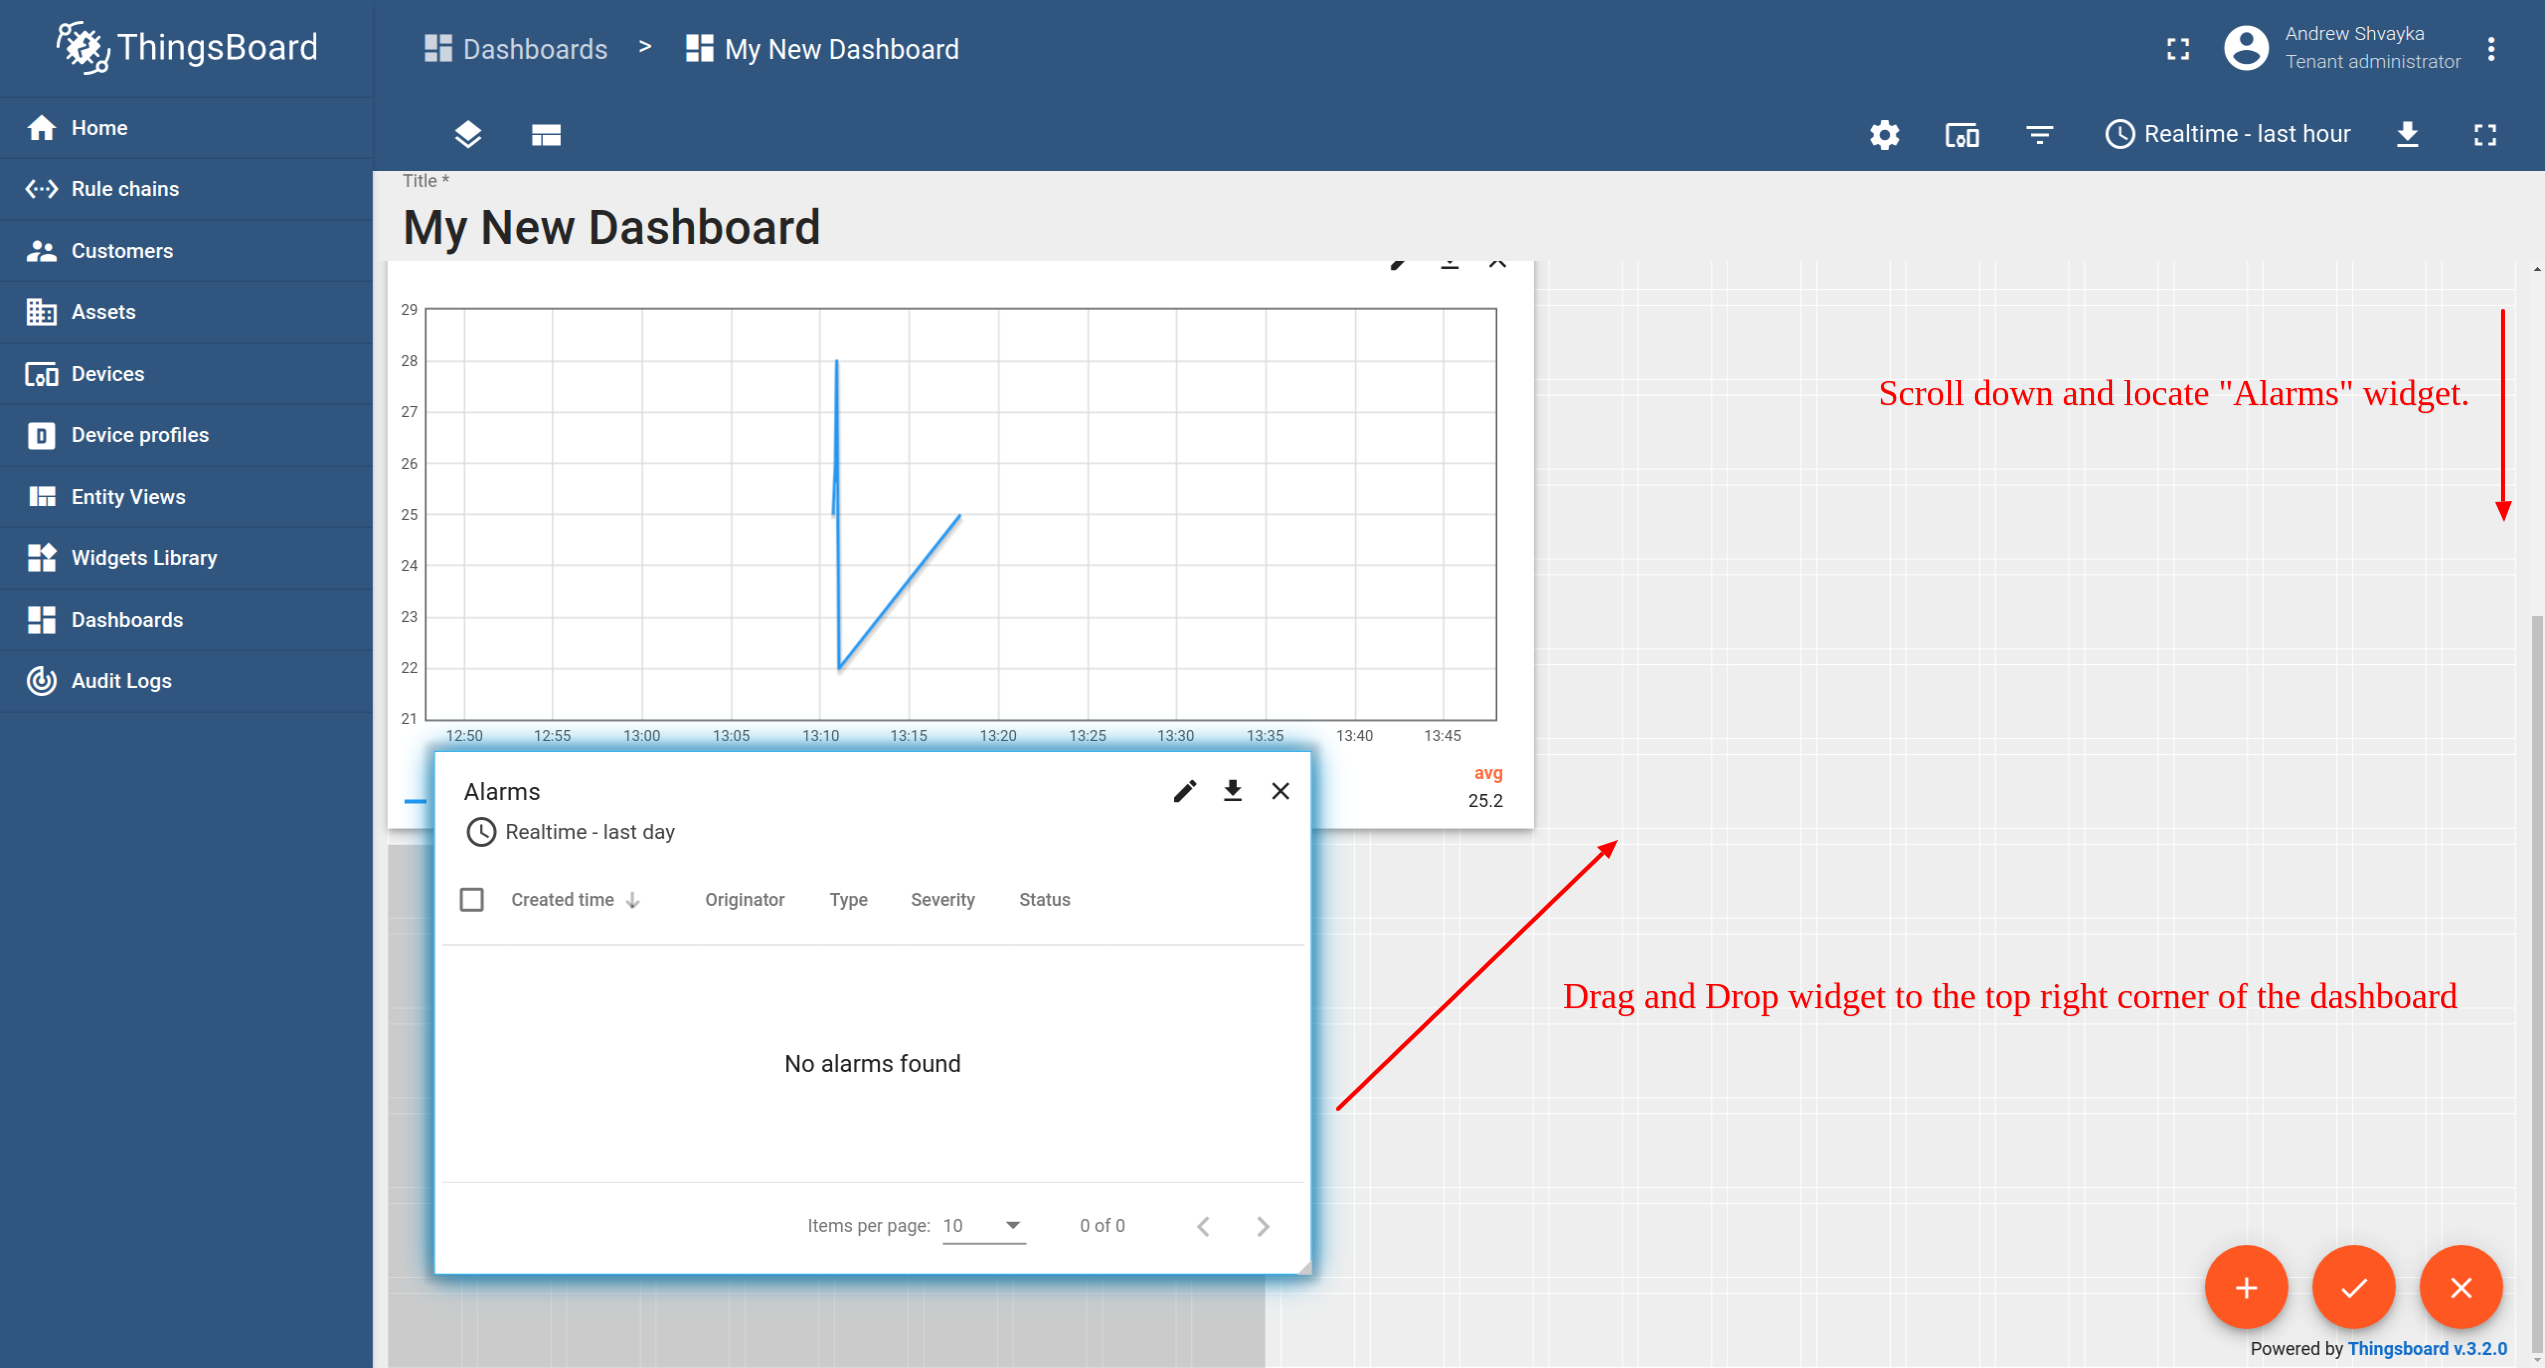
- Scroll down and locate the new "Alarms" widget. Drag and Drop widget to the top right corner of the dashboard.
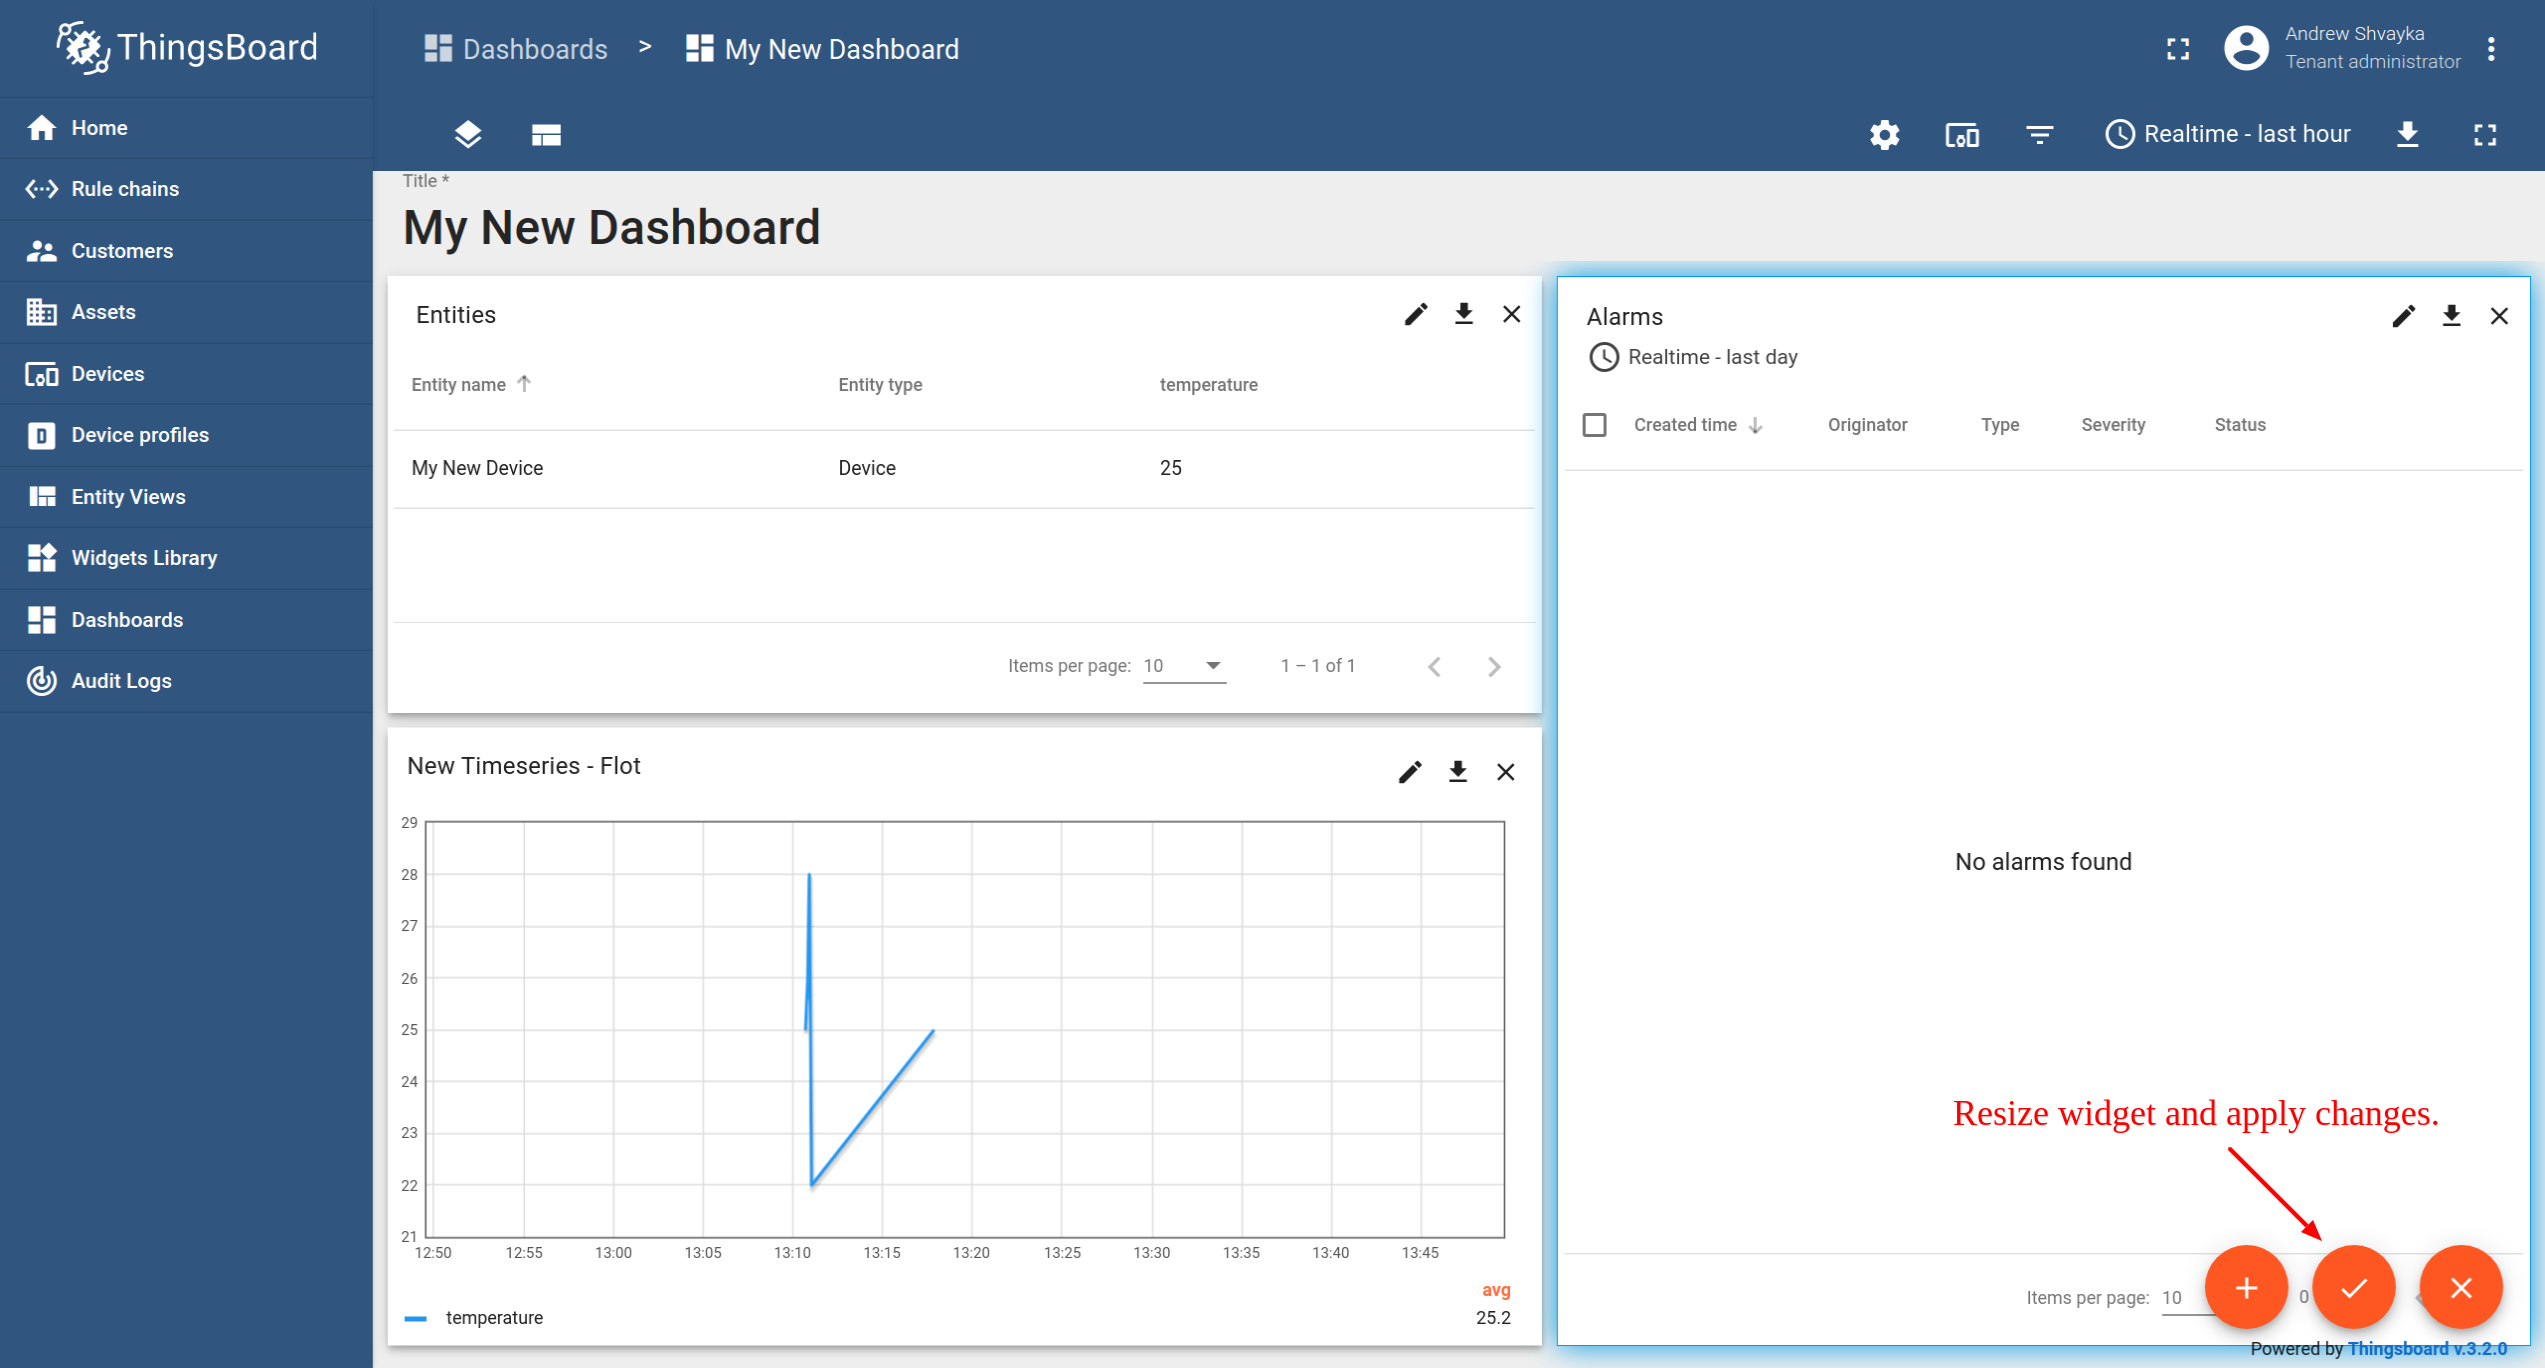
- Redimensione o widget e aplique as alterações.
Congratulations! You have added an alarm widget. Now it’s time to configure alarm rules and raise some alarms.
Passo 4. Configurar regras de Alarme
We will use the alarm rules feature to raise alarm when the temperature reading is greater than 25 degrees. Para isso, devemos editar o perfil do dispositivo e adicionar uma nova regra de alarme. The “My New Device” is using the “Default” device profile. We recommend creating dedicated device profiles for each corresponding device type but will skip this step for simplicity.
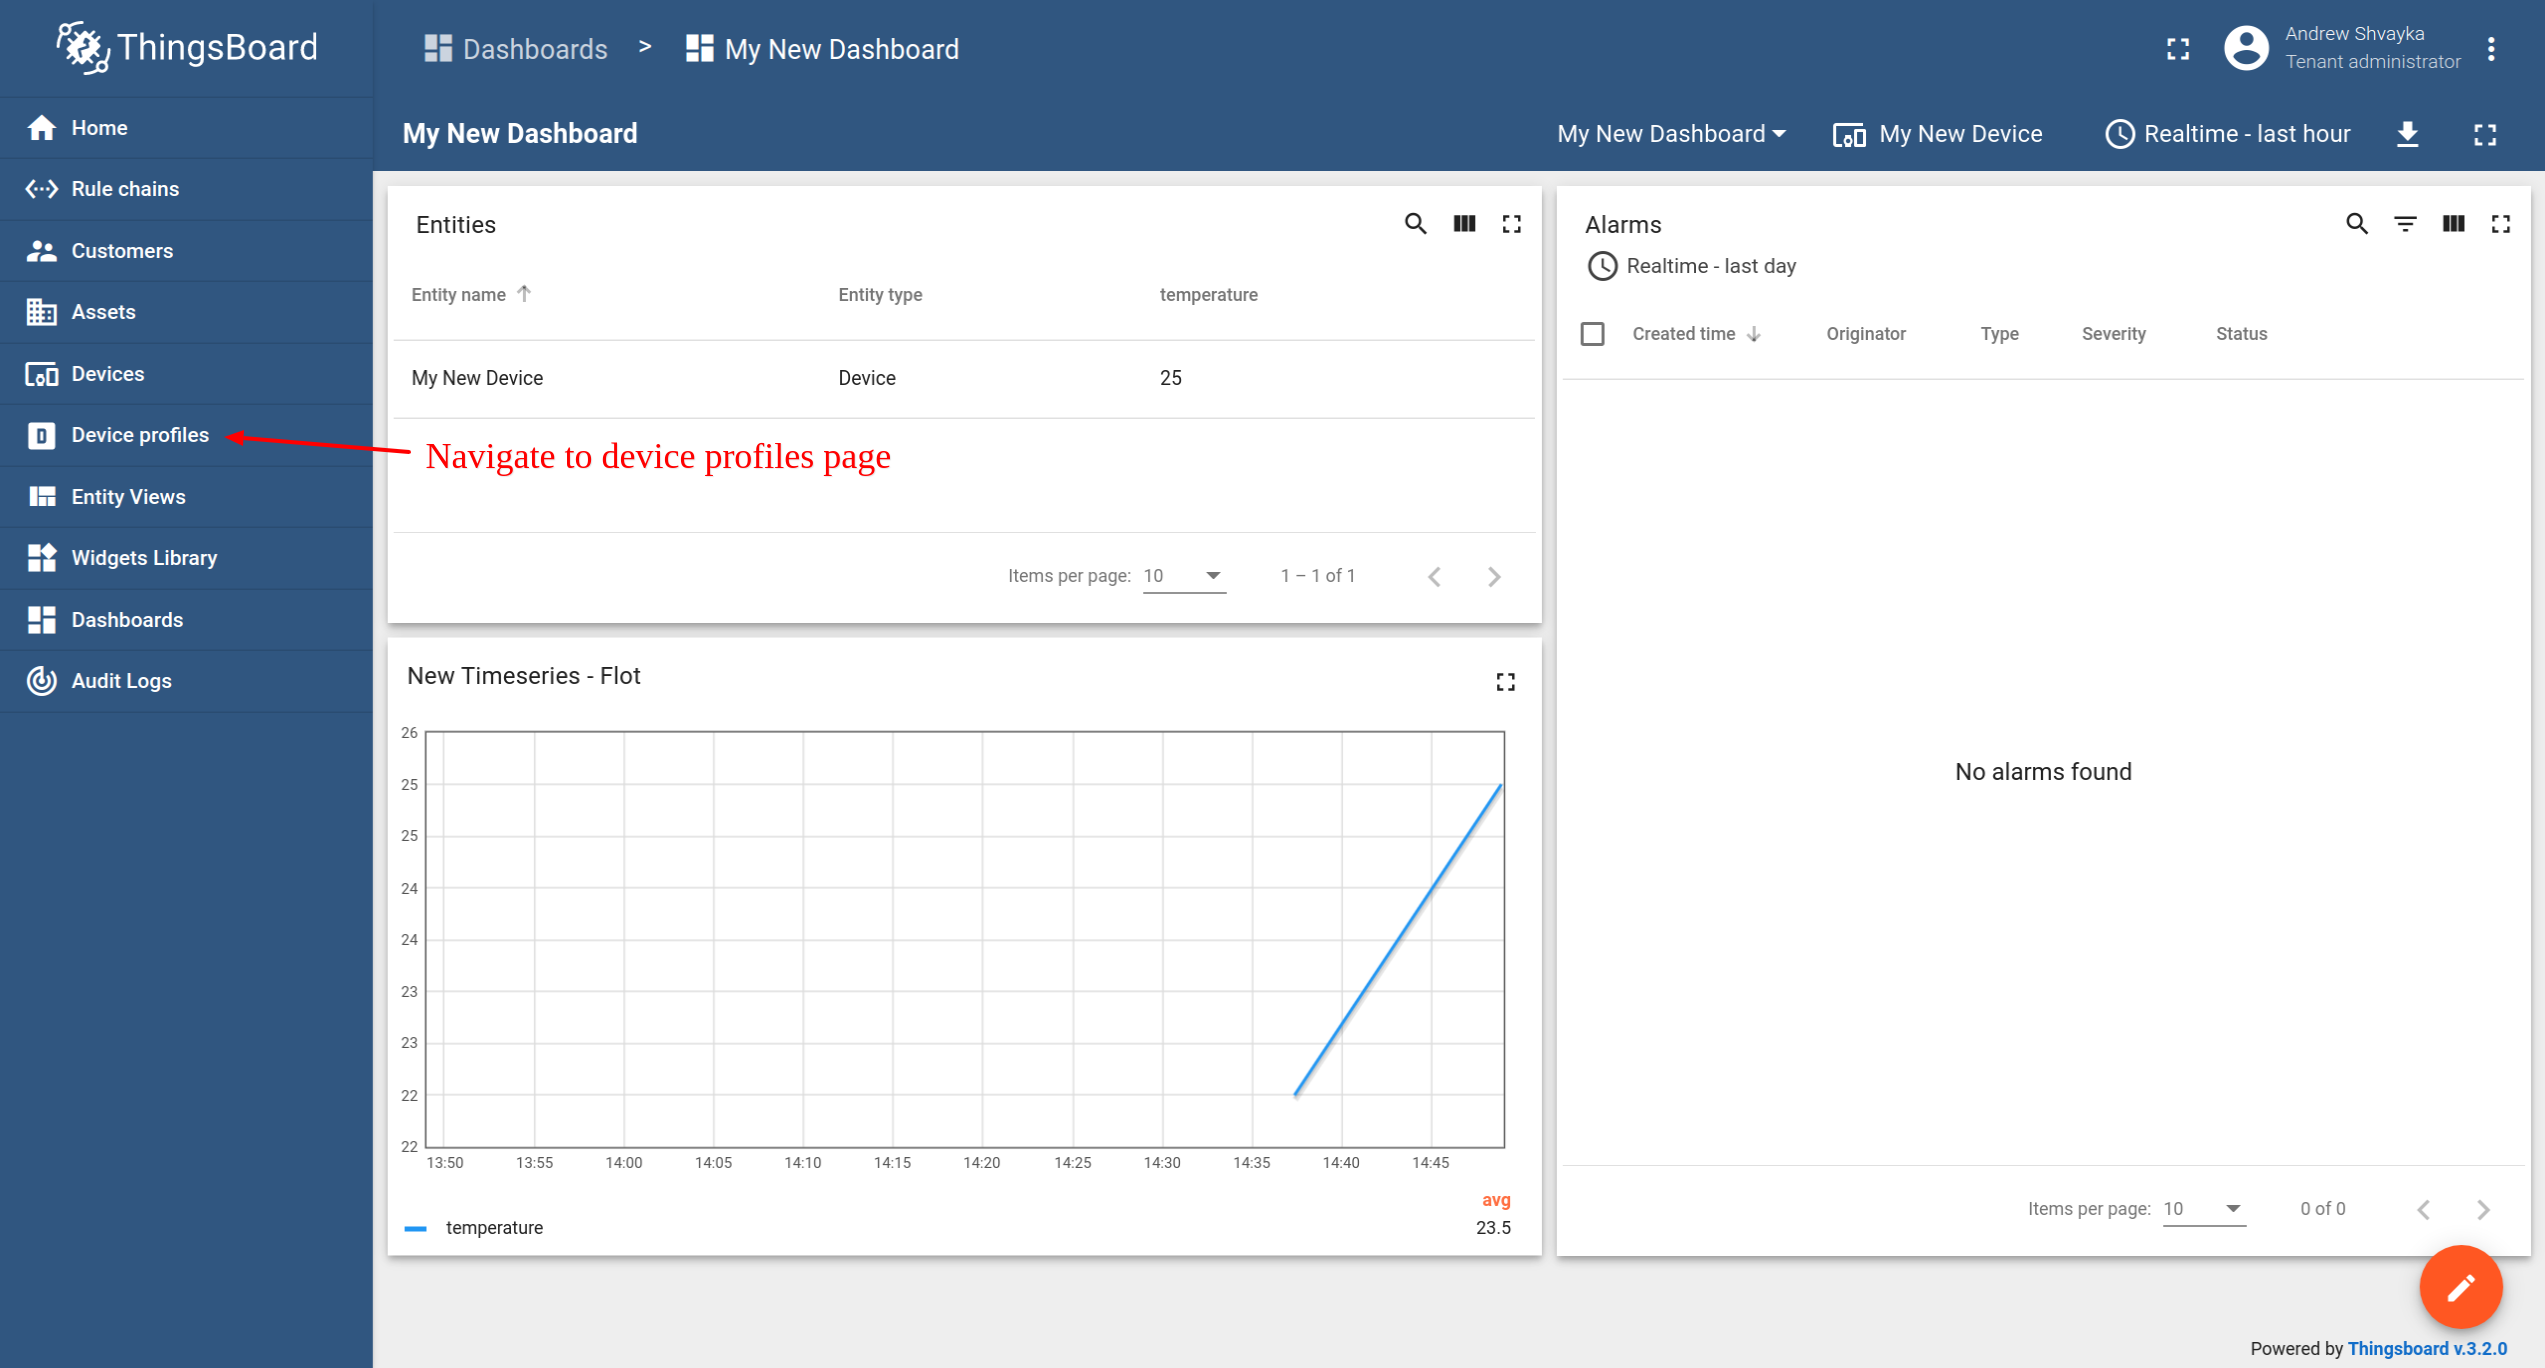
- Navegue até a página de perfis de dispositivo.
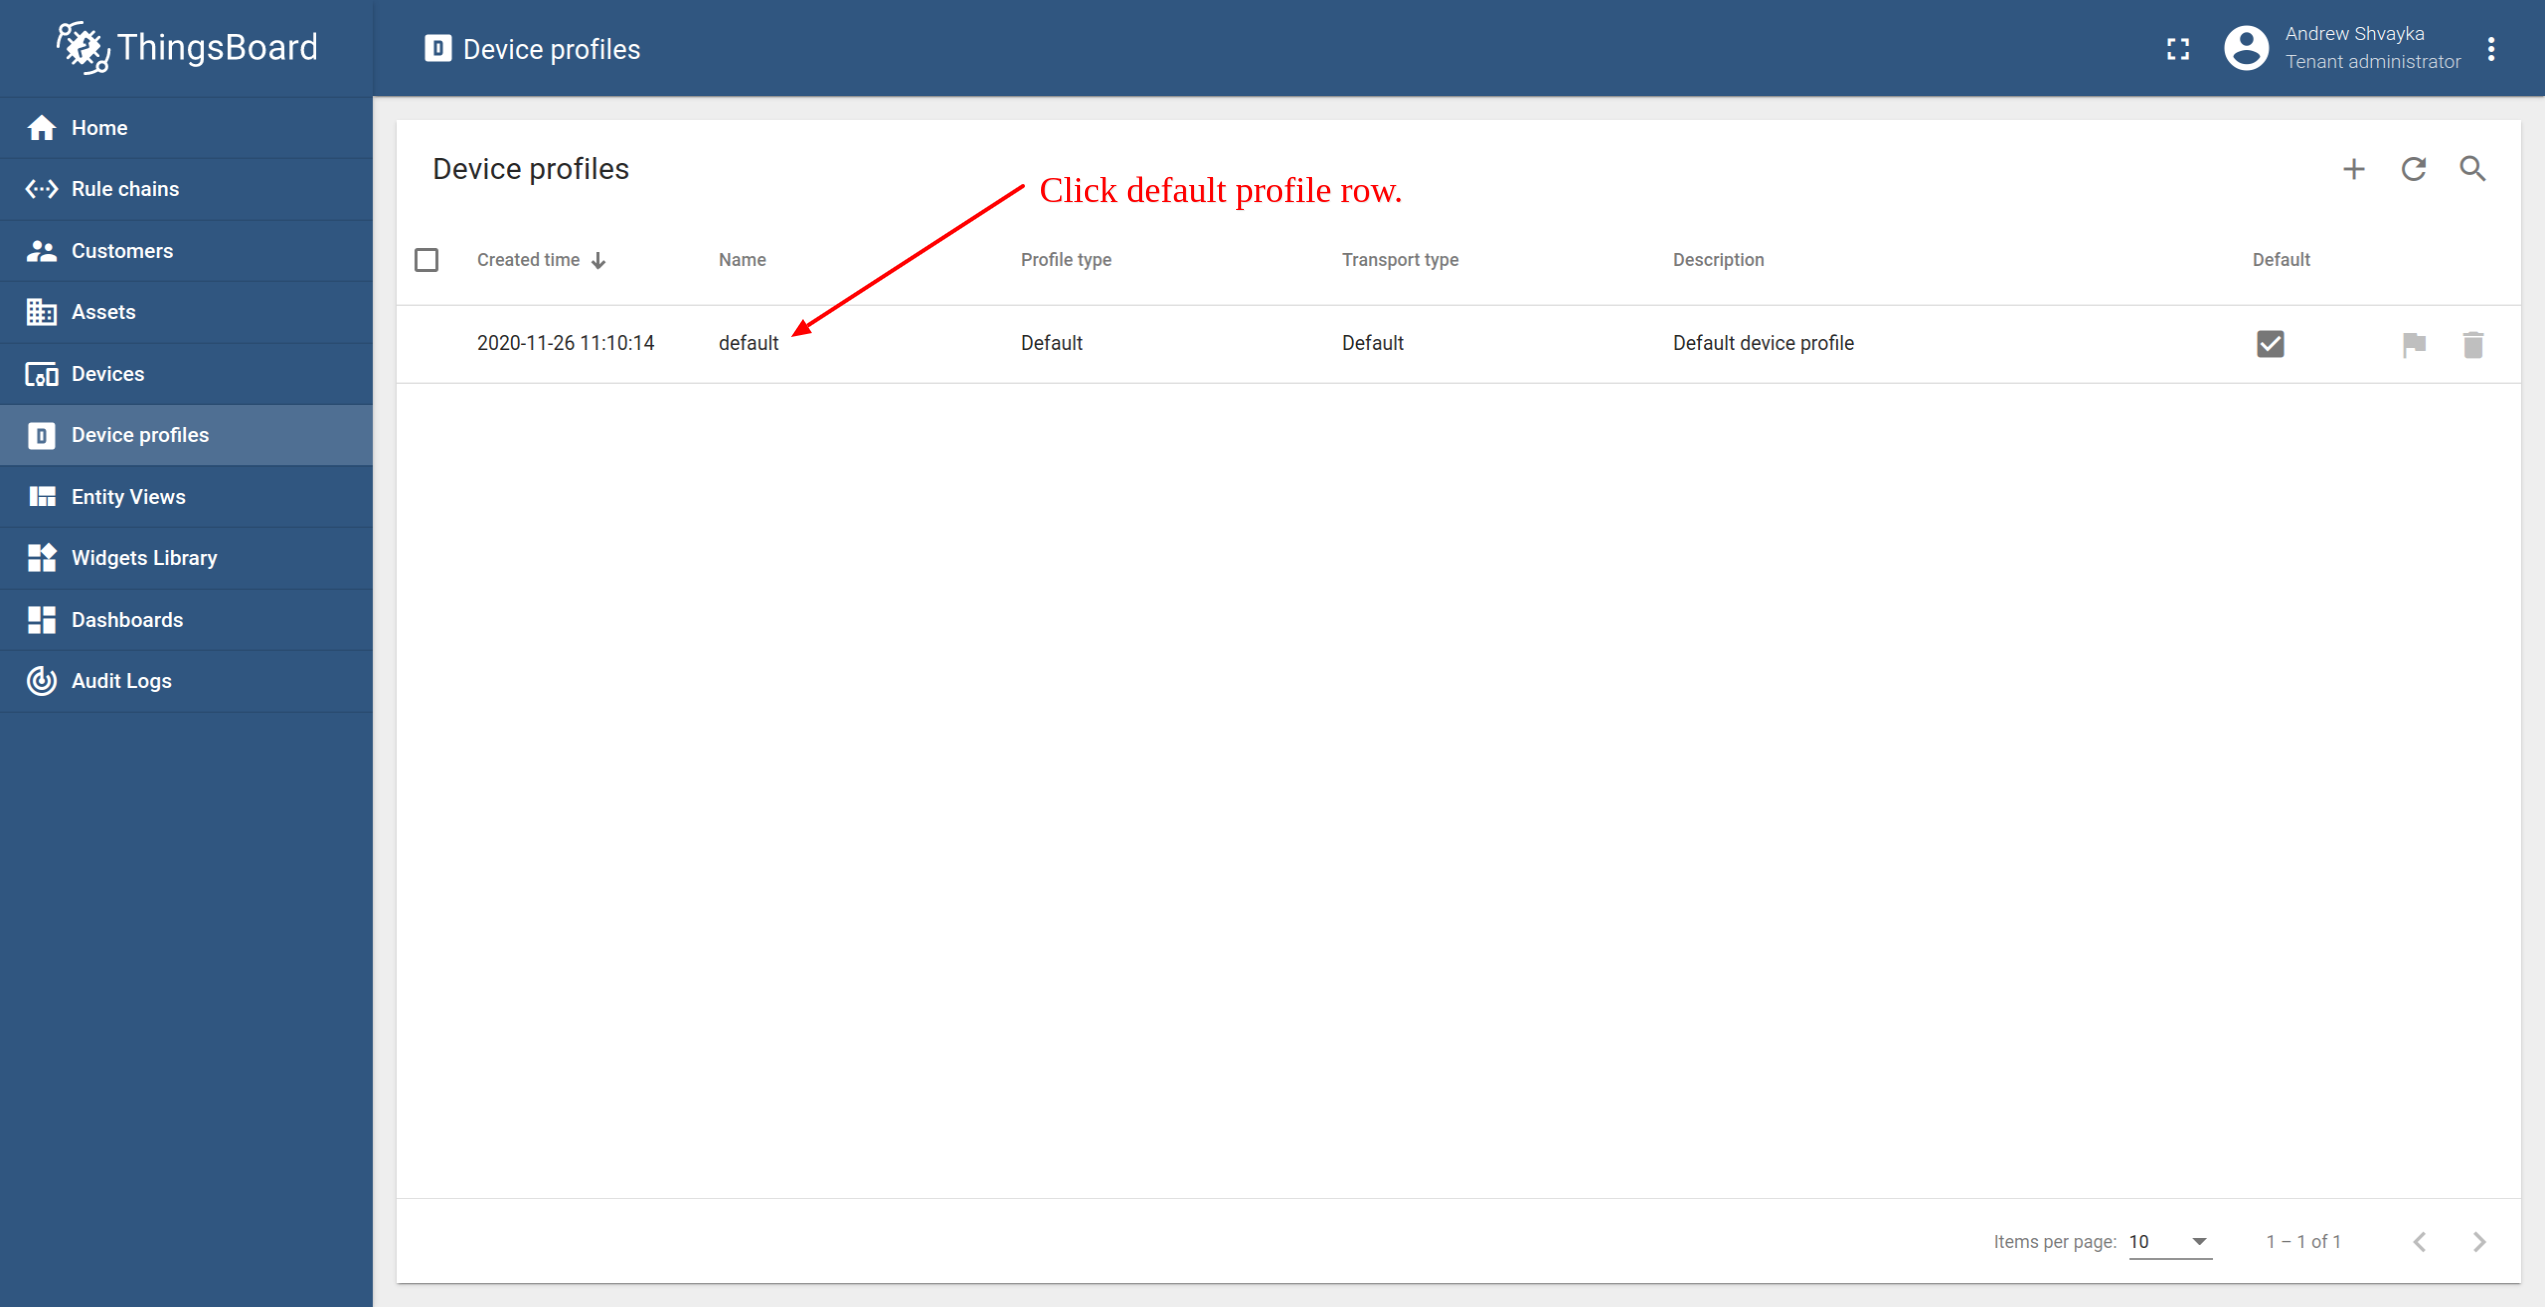
- Clique na linha de perfil padrão. Isso abrirá os detalhes do perfil do dispositivo.
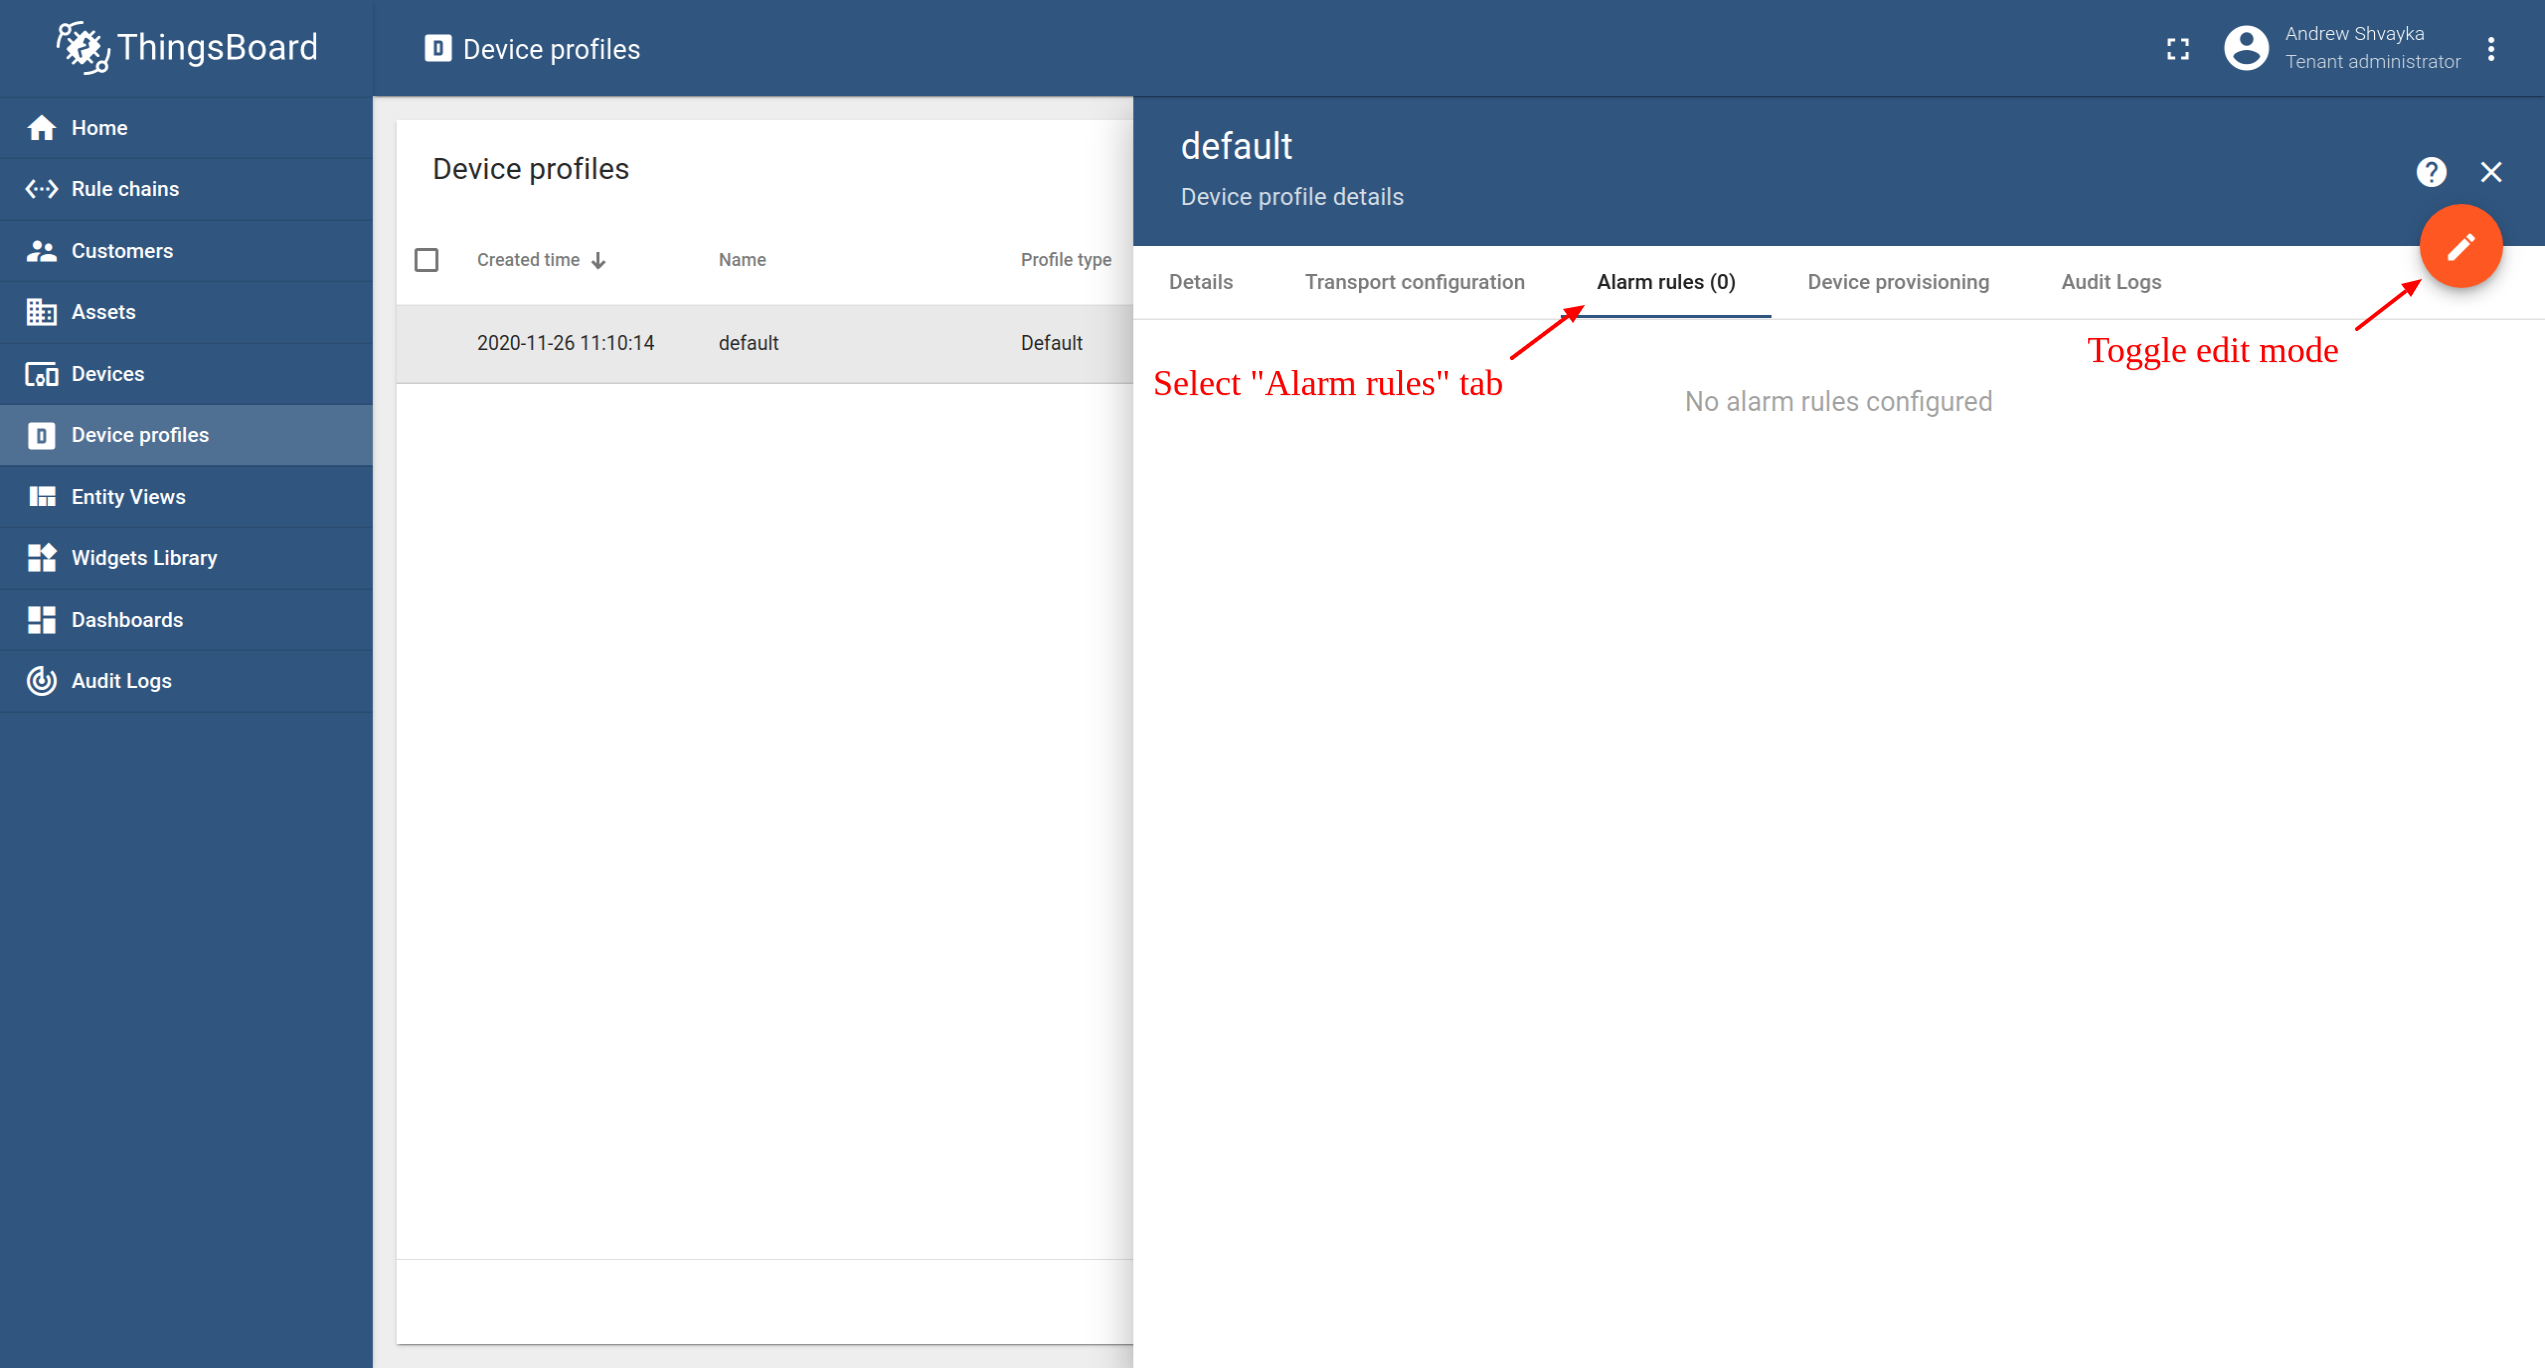
- Selecione a guia "Regras de alarme" e alterne o modo de edição.
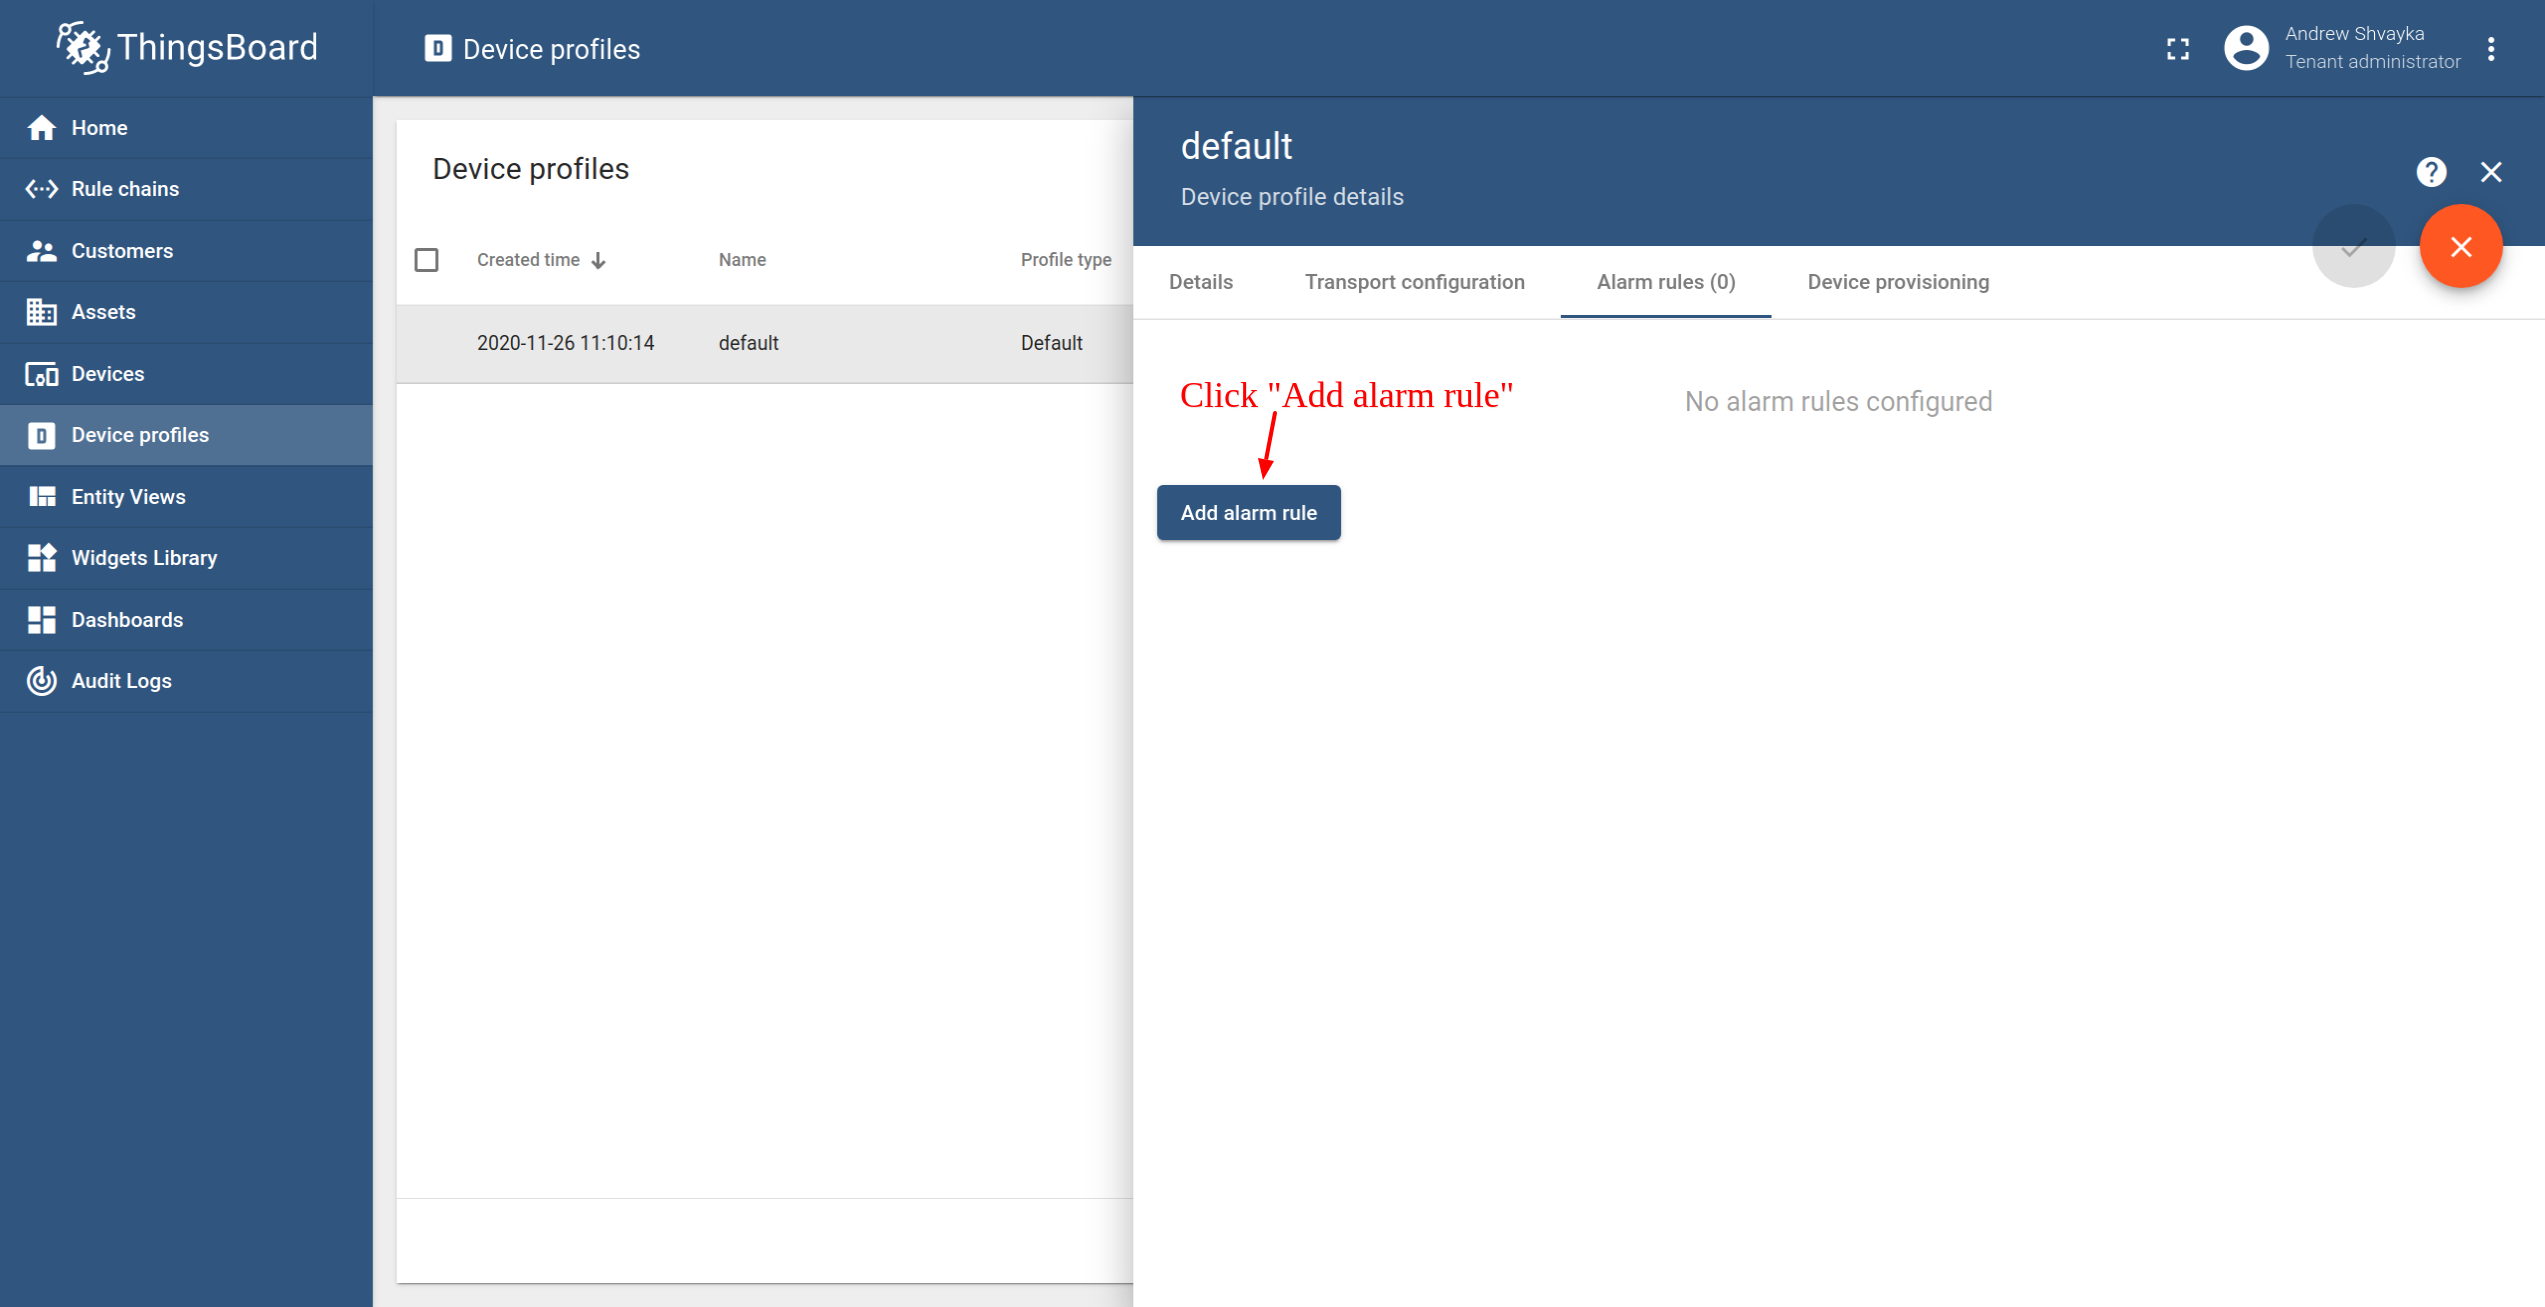
- Clique em "Adicionar regra de alarme".
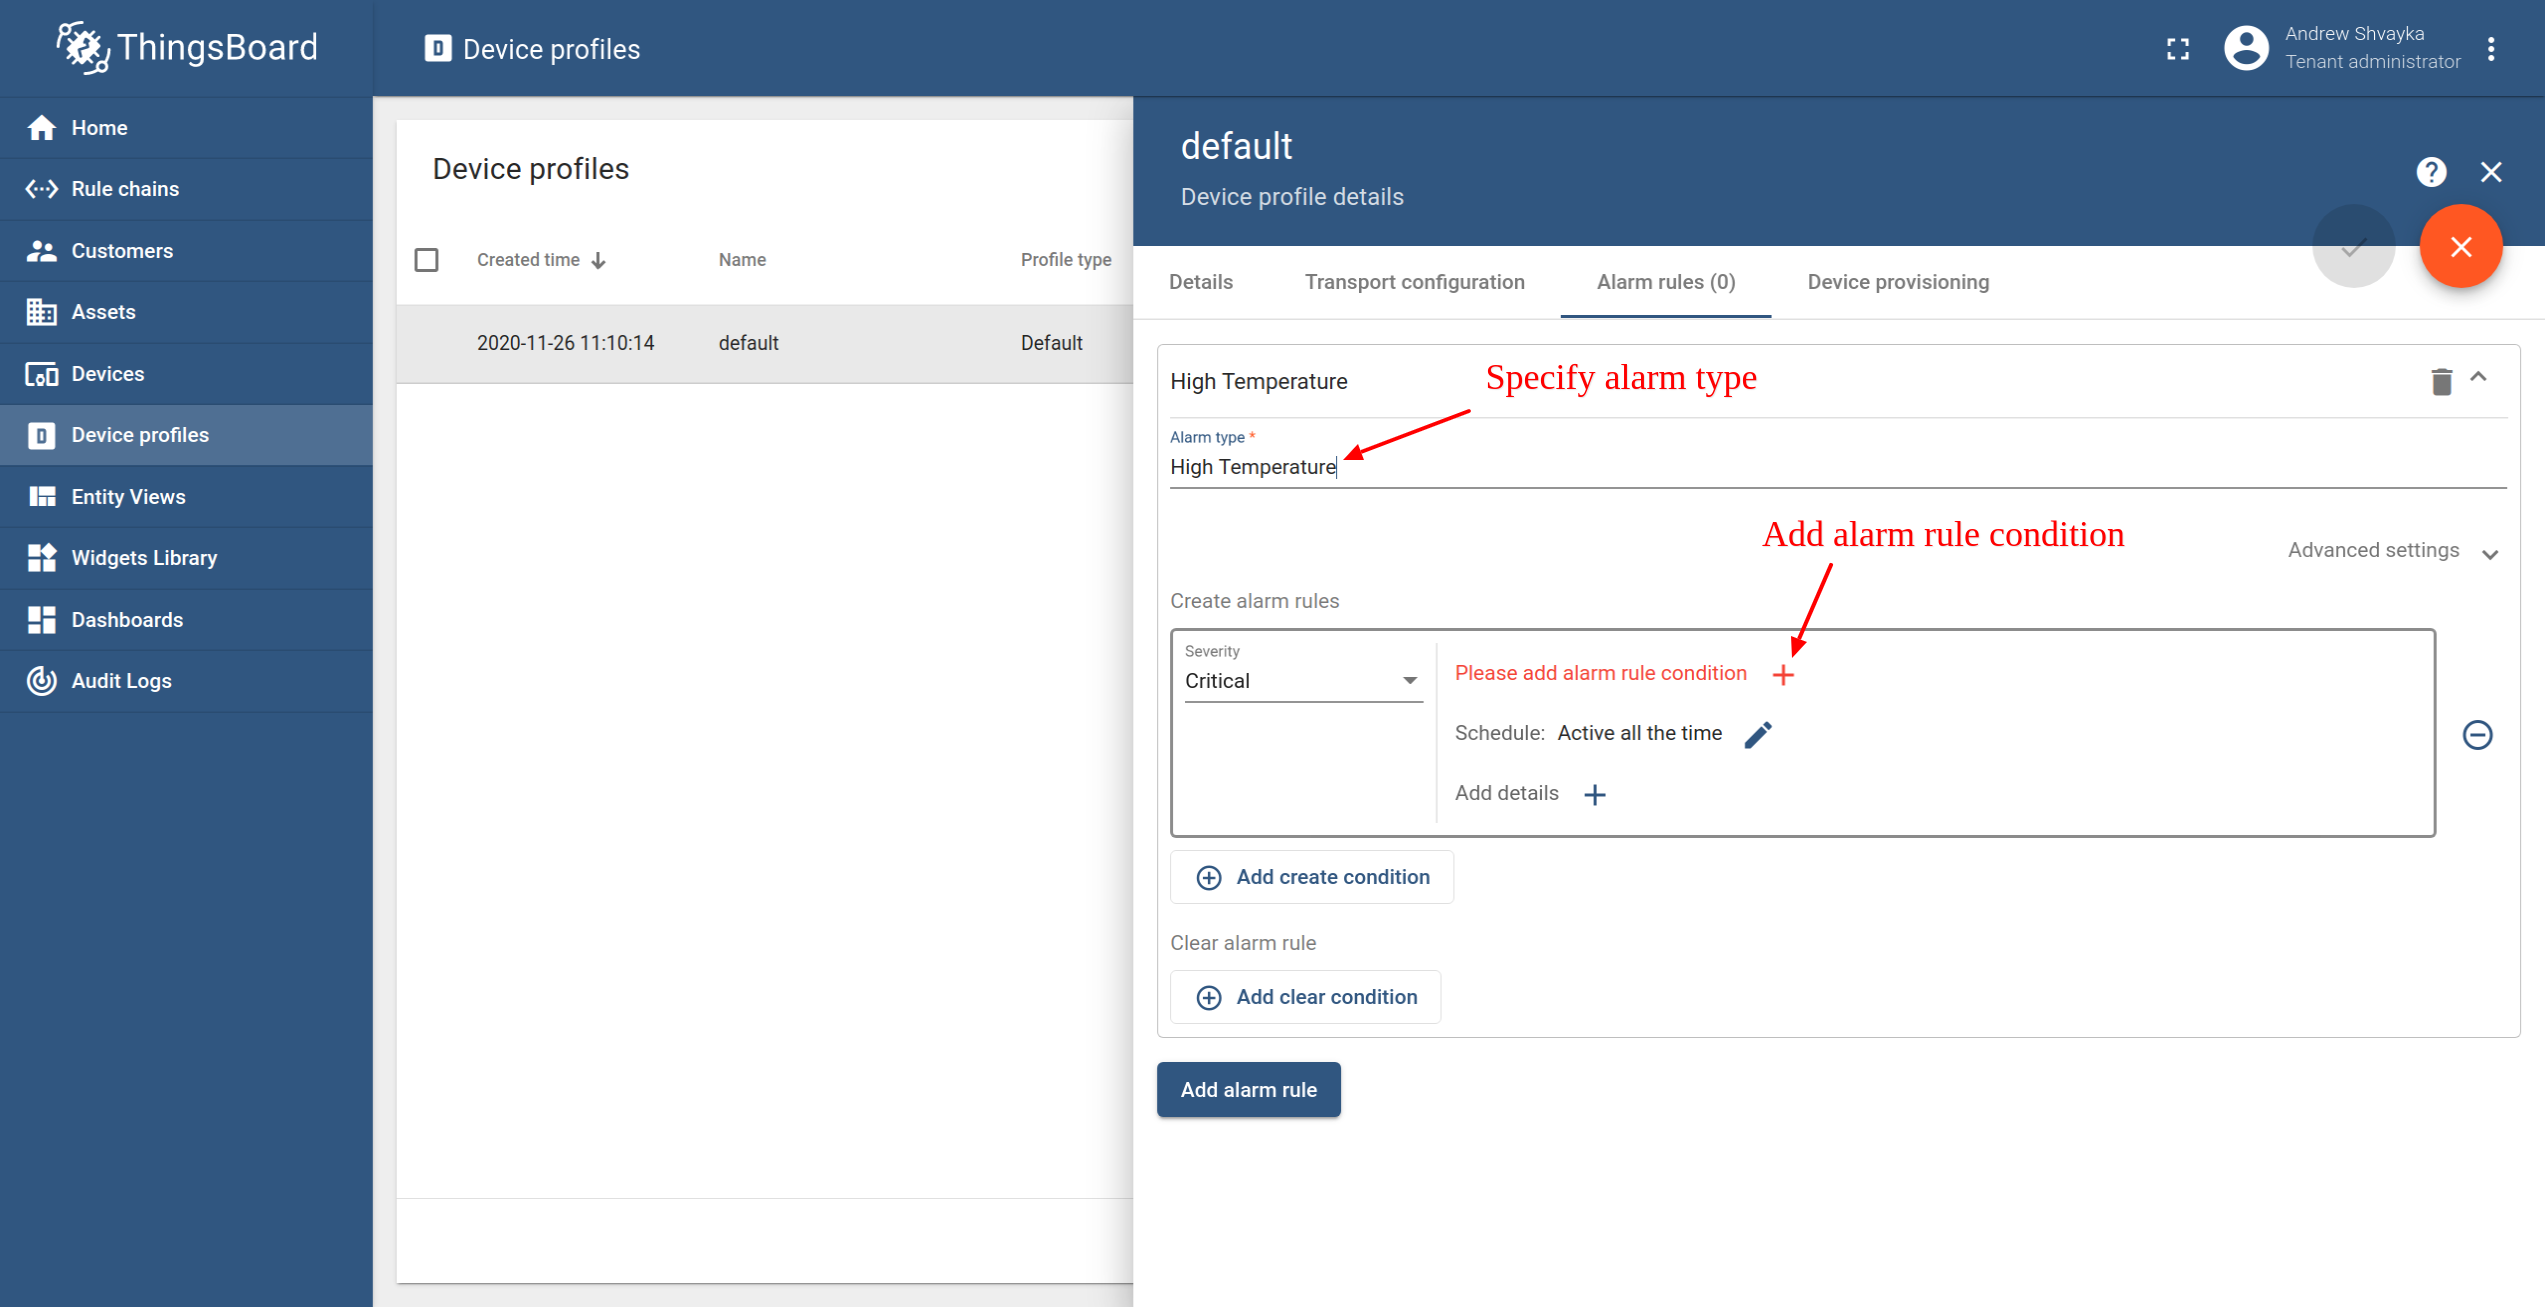
- Especifique o tipo de alarme e clique no ícone "+" para adicionar a condição da regra de alarme.
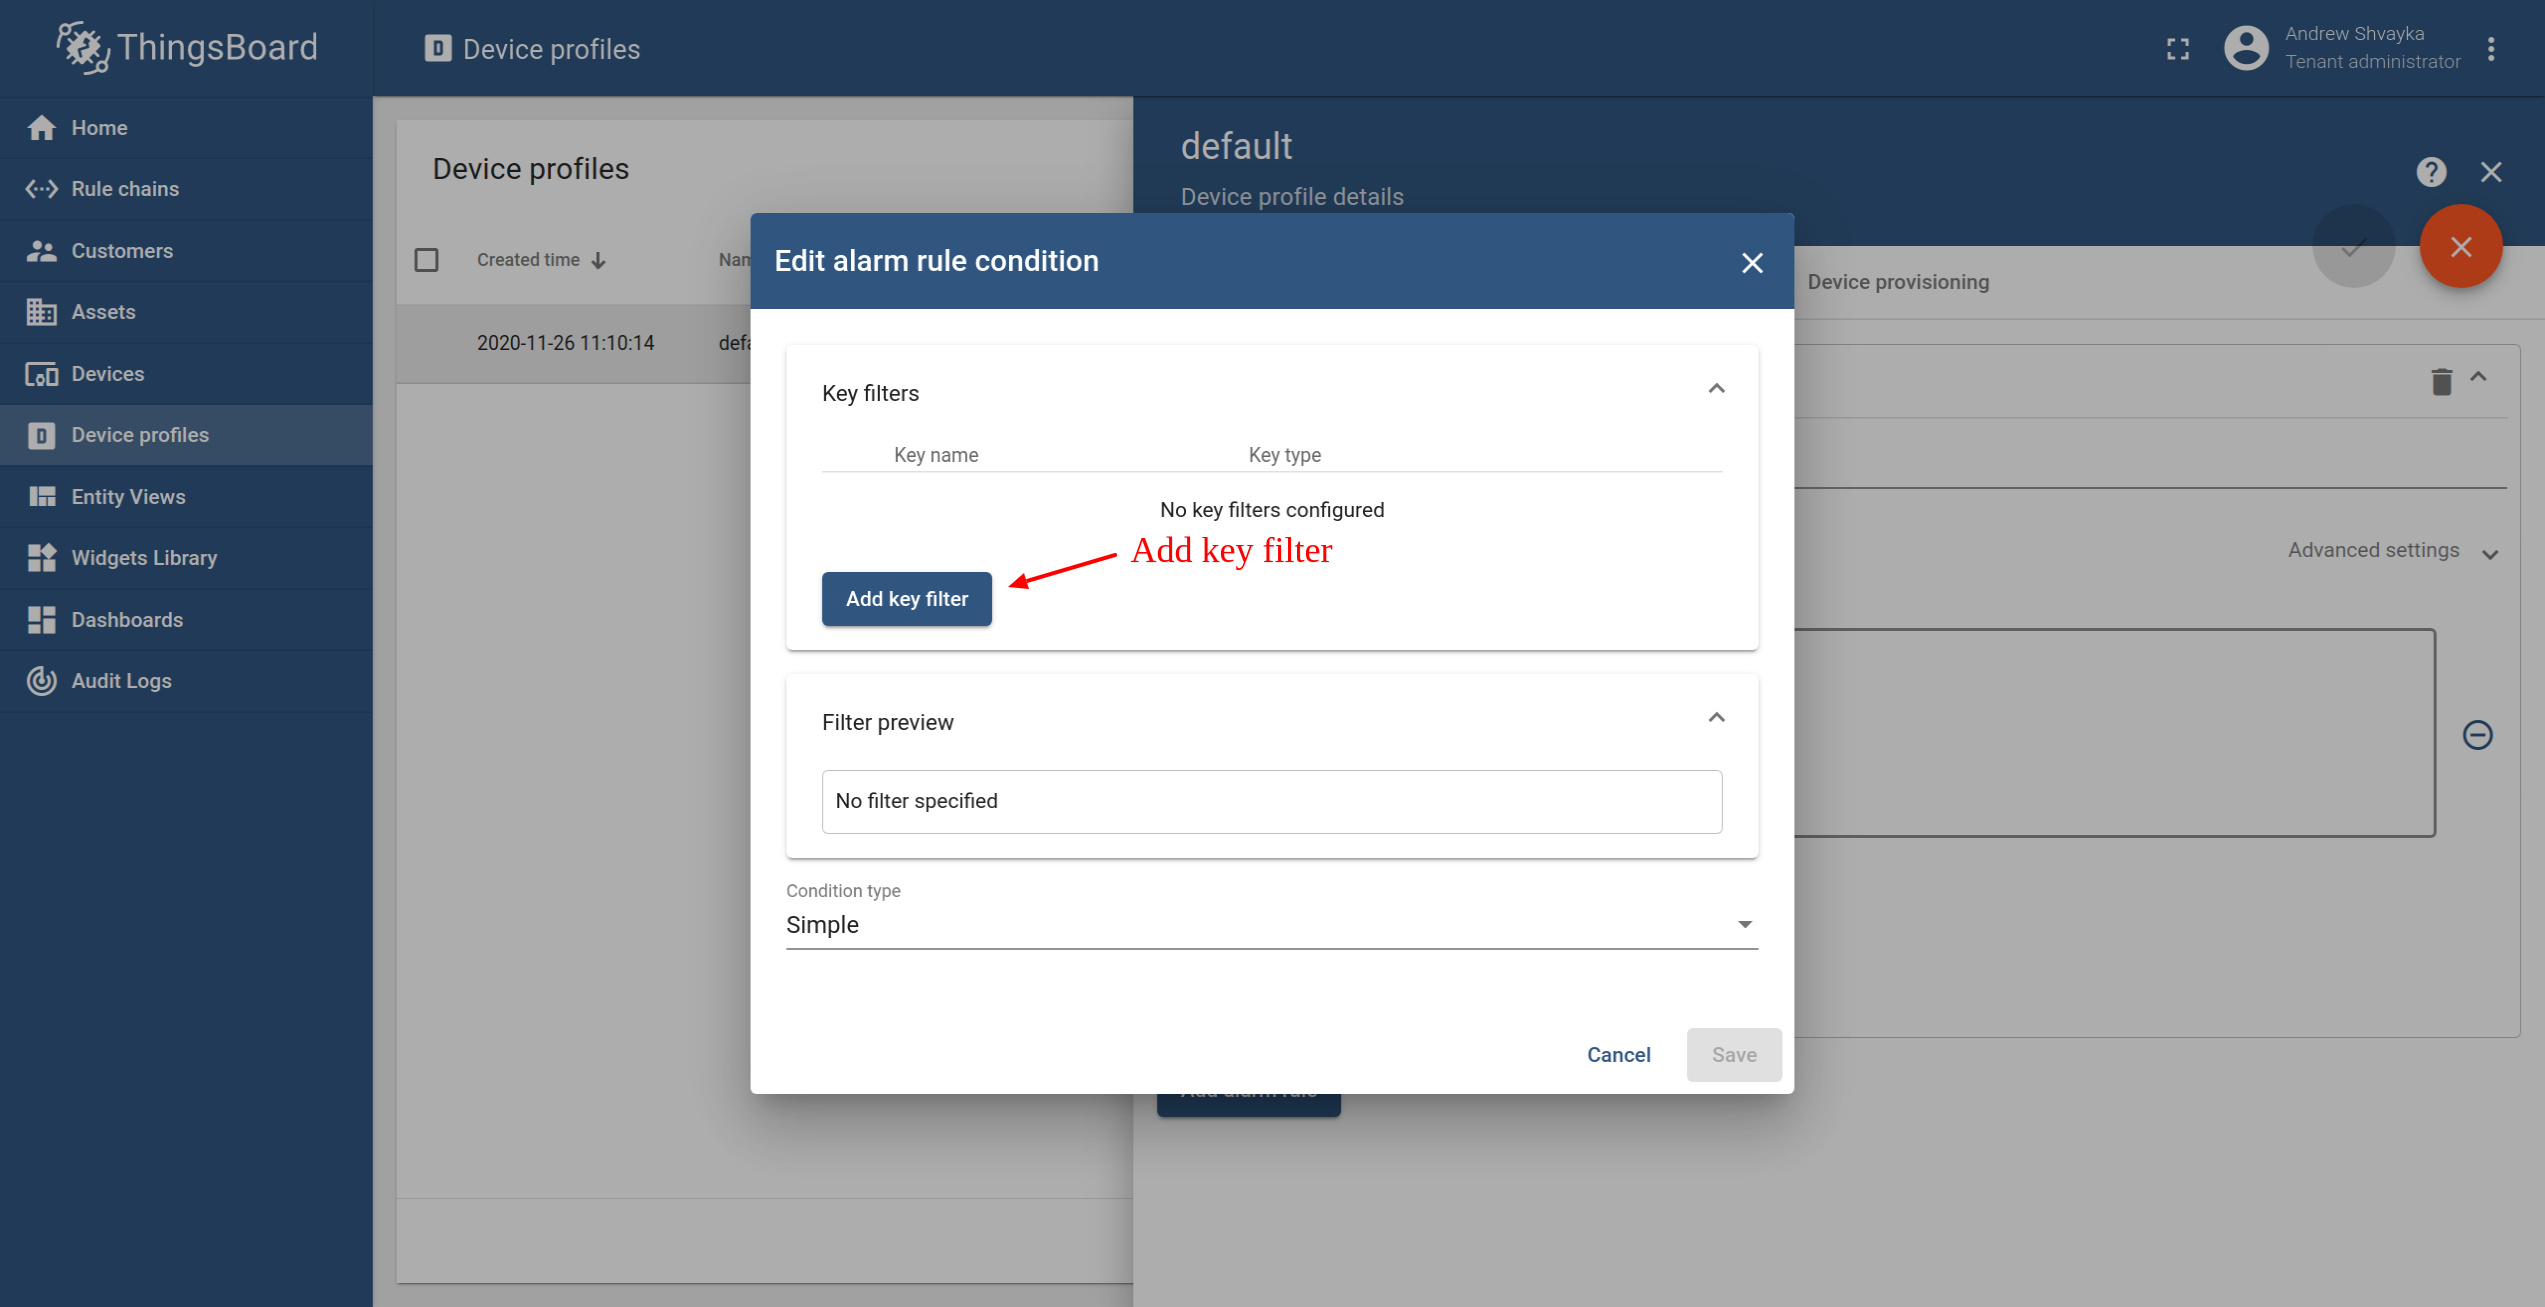
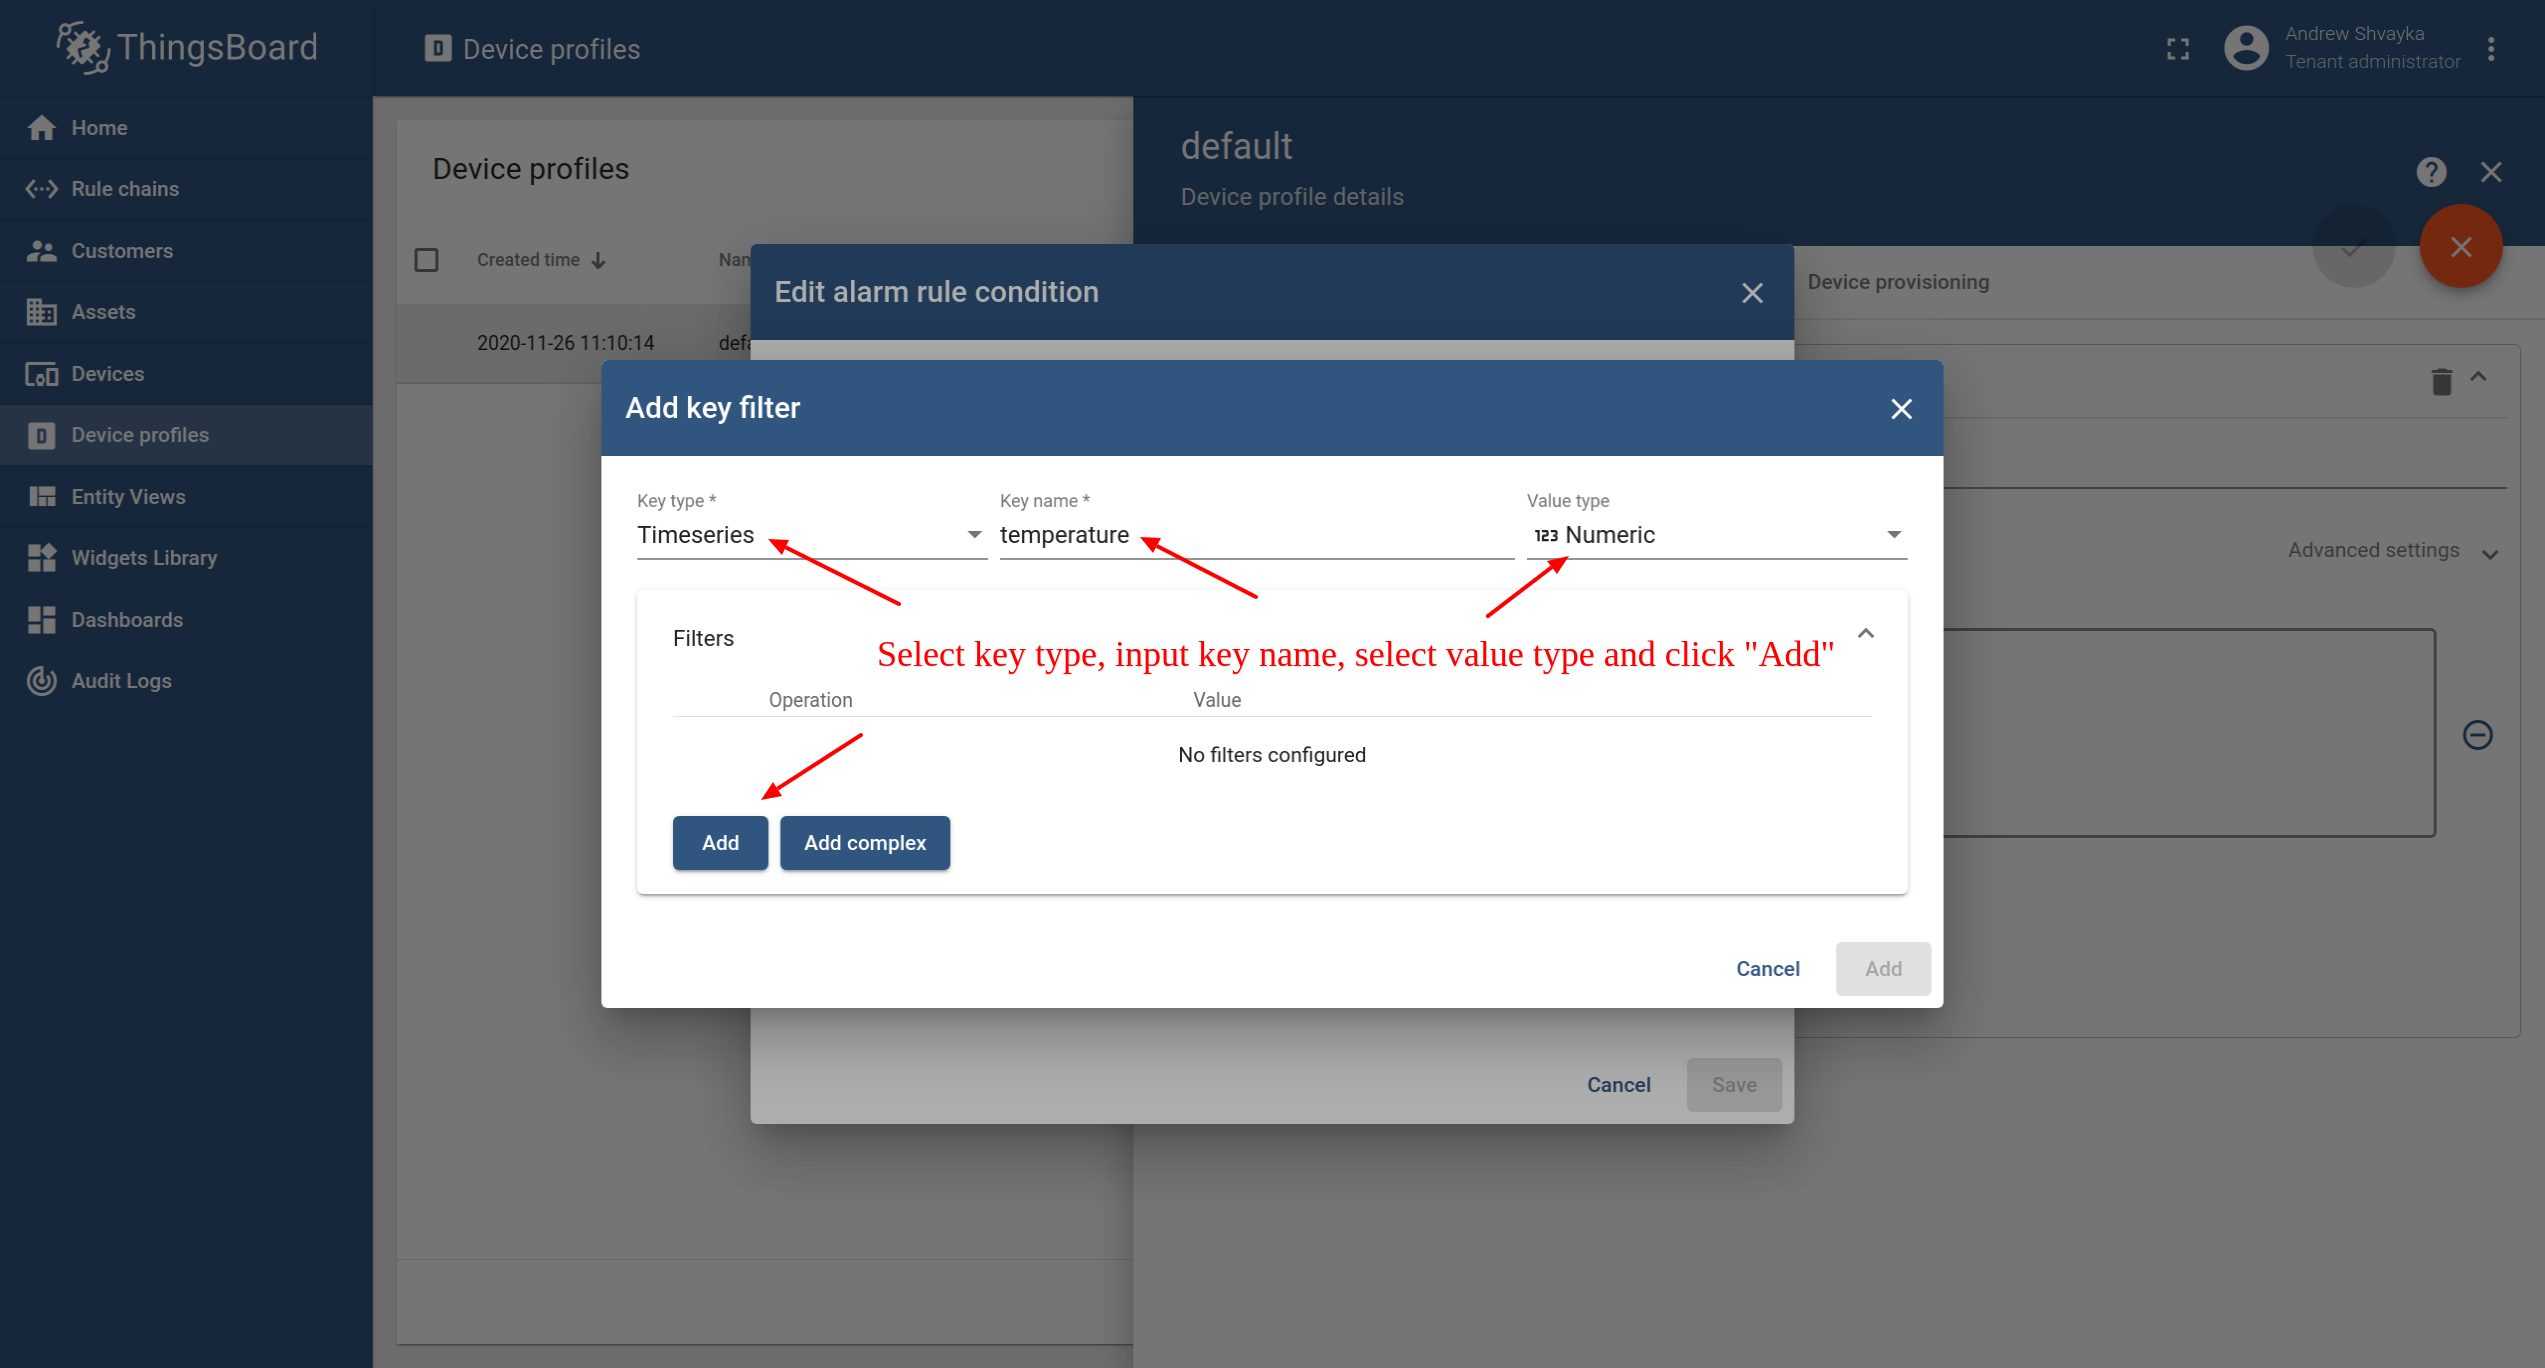
- Clique no botão "Adicionar filtro-chave" para especificar uma condição.
- Selecione o tipo de chave, insira o nome da chave, selecione o tipo do valor e clique em "Adicionar".
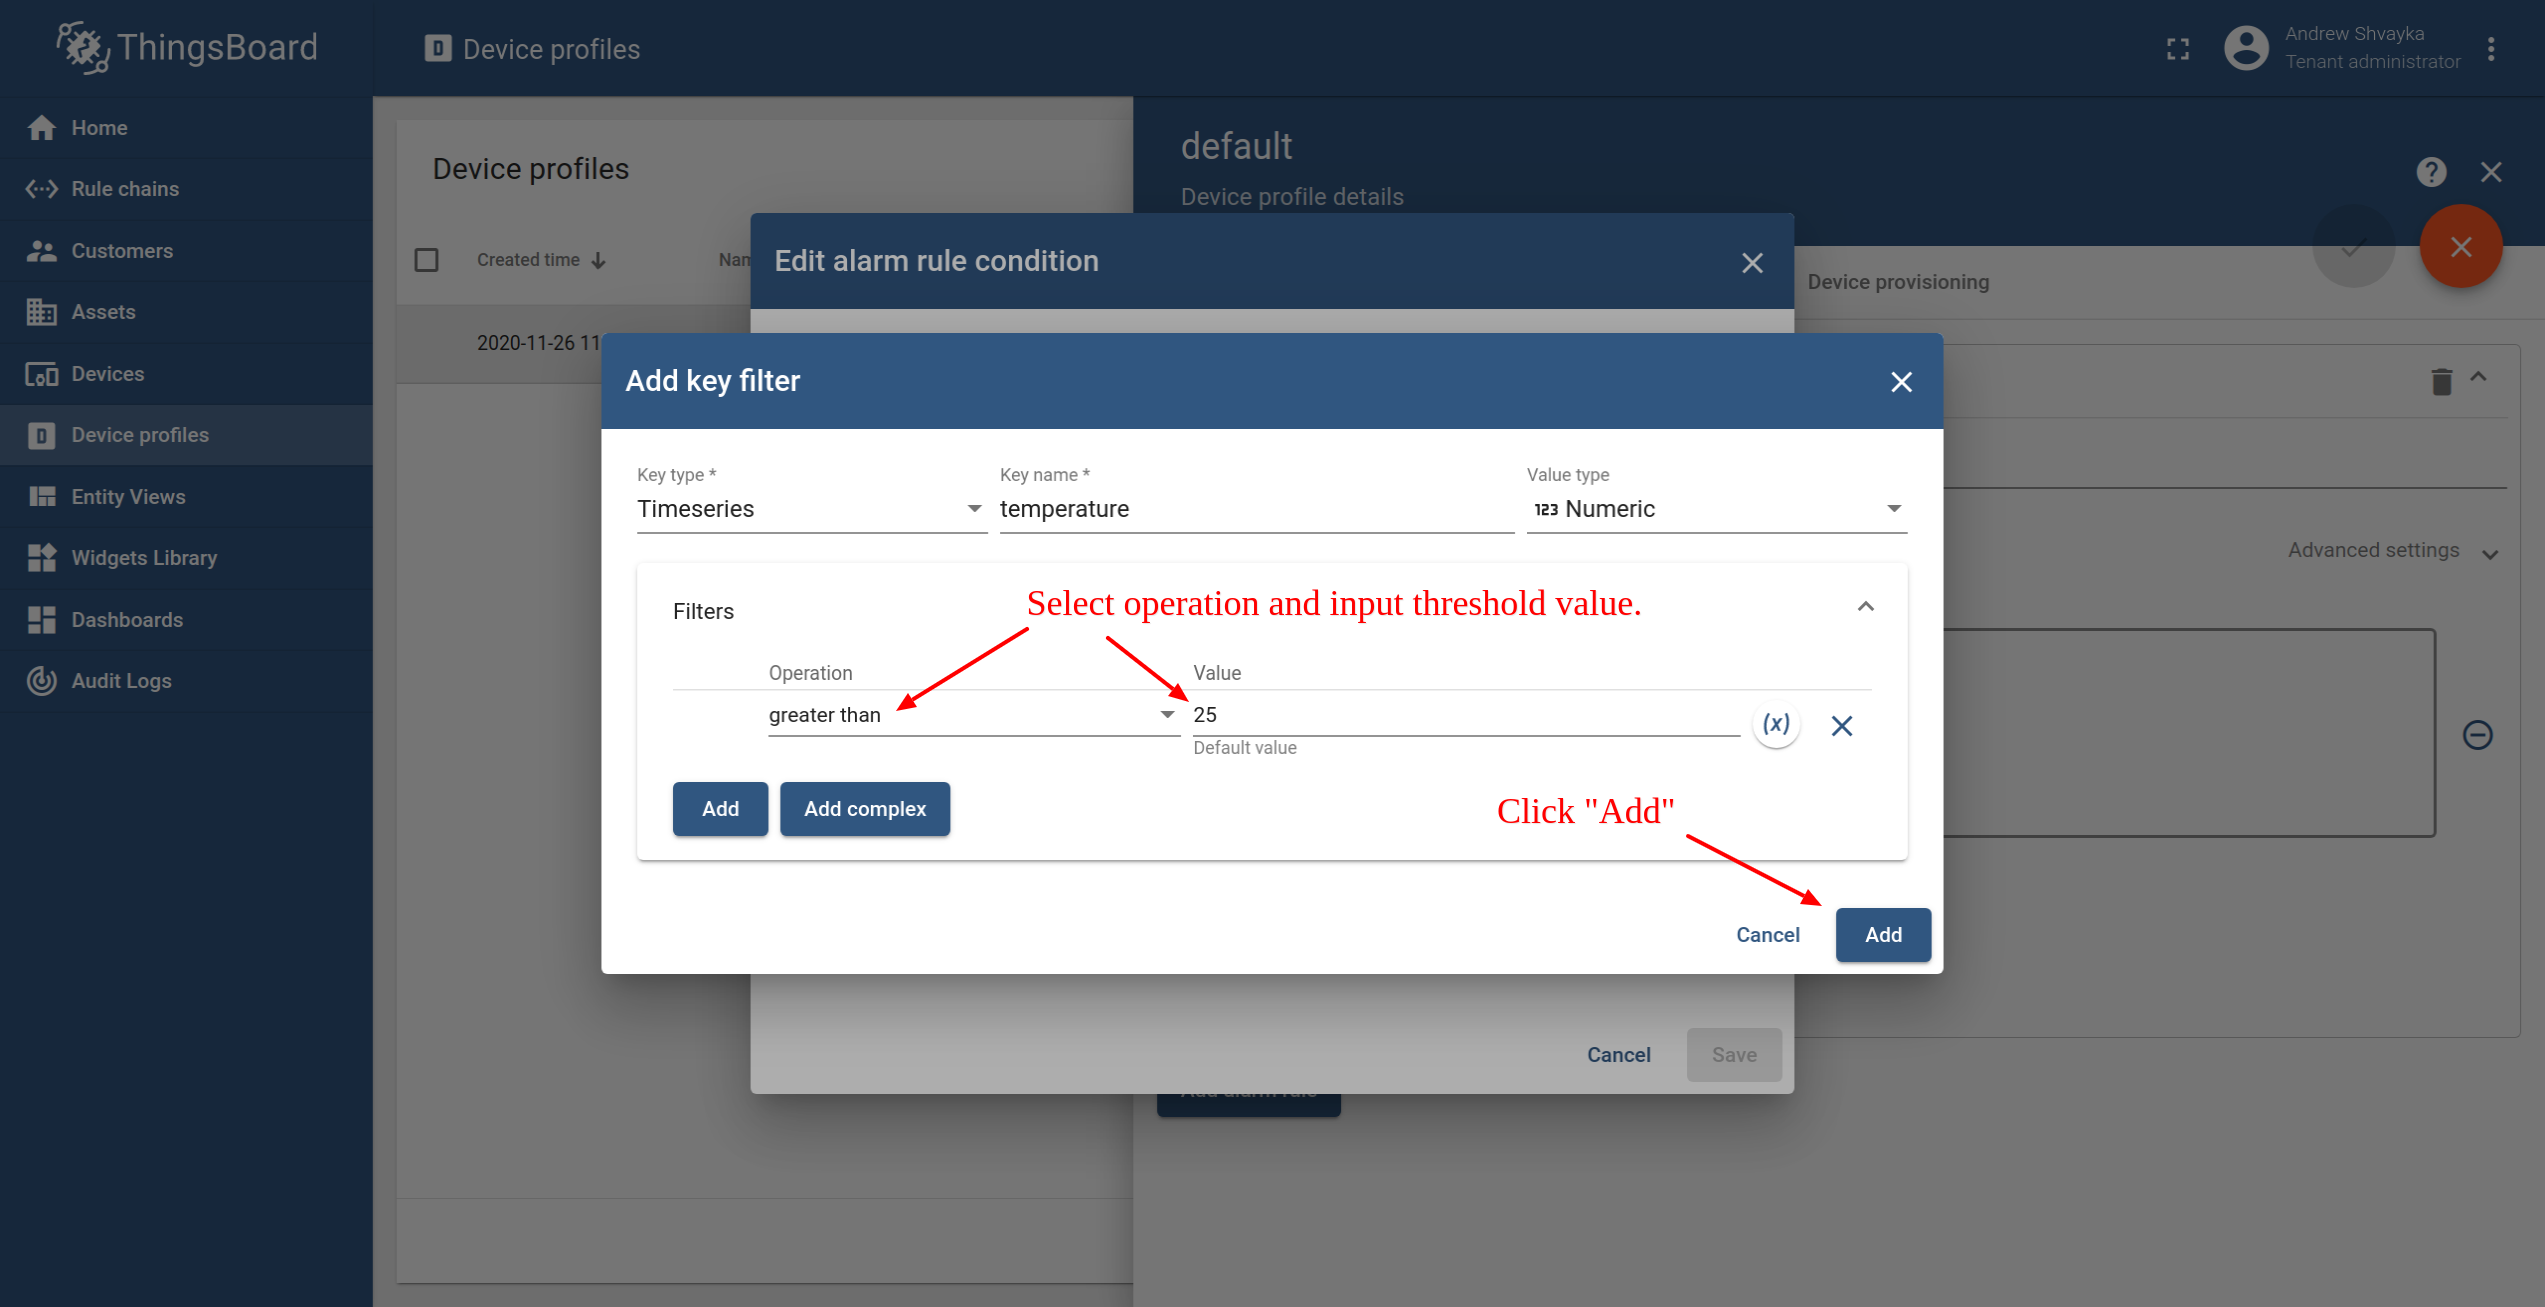
- Selecione a operação e o valor do limite de entrada. Clique em "Adicionar".
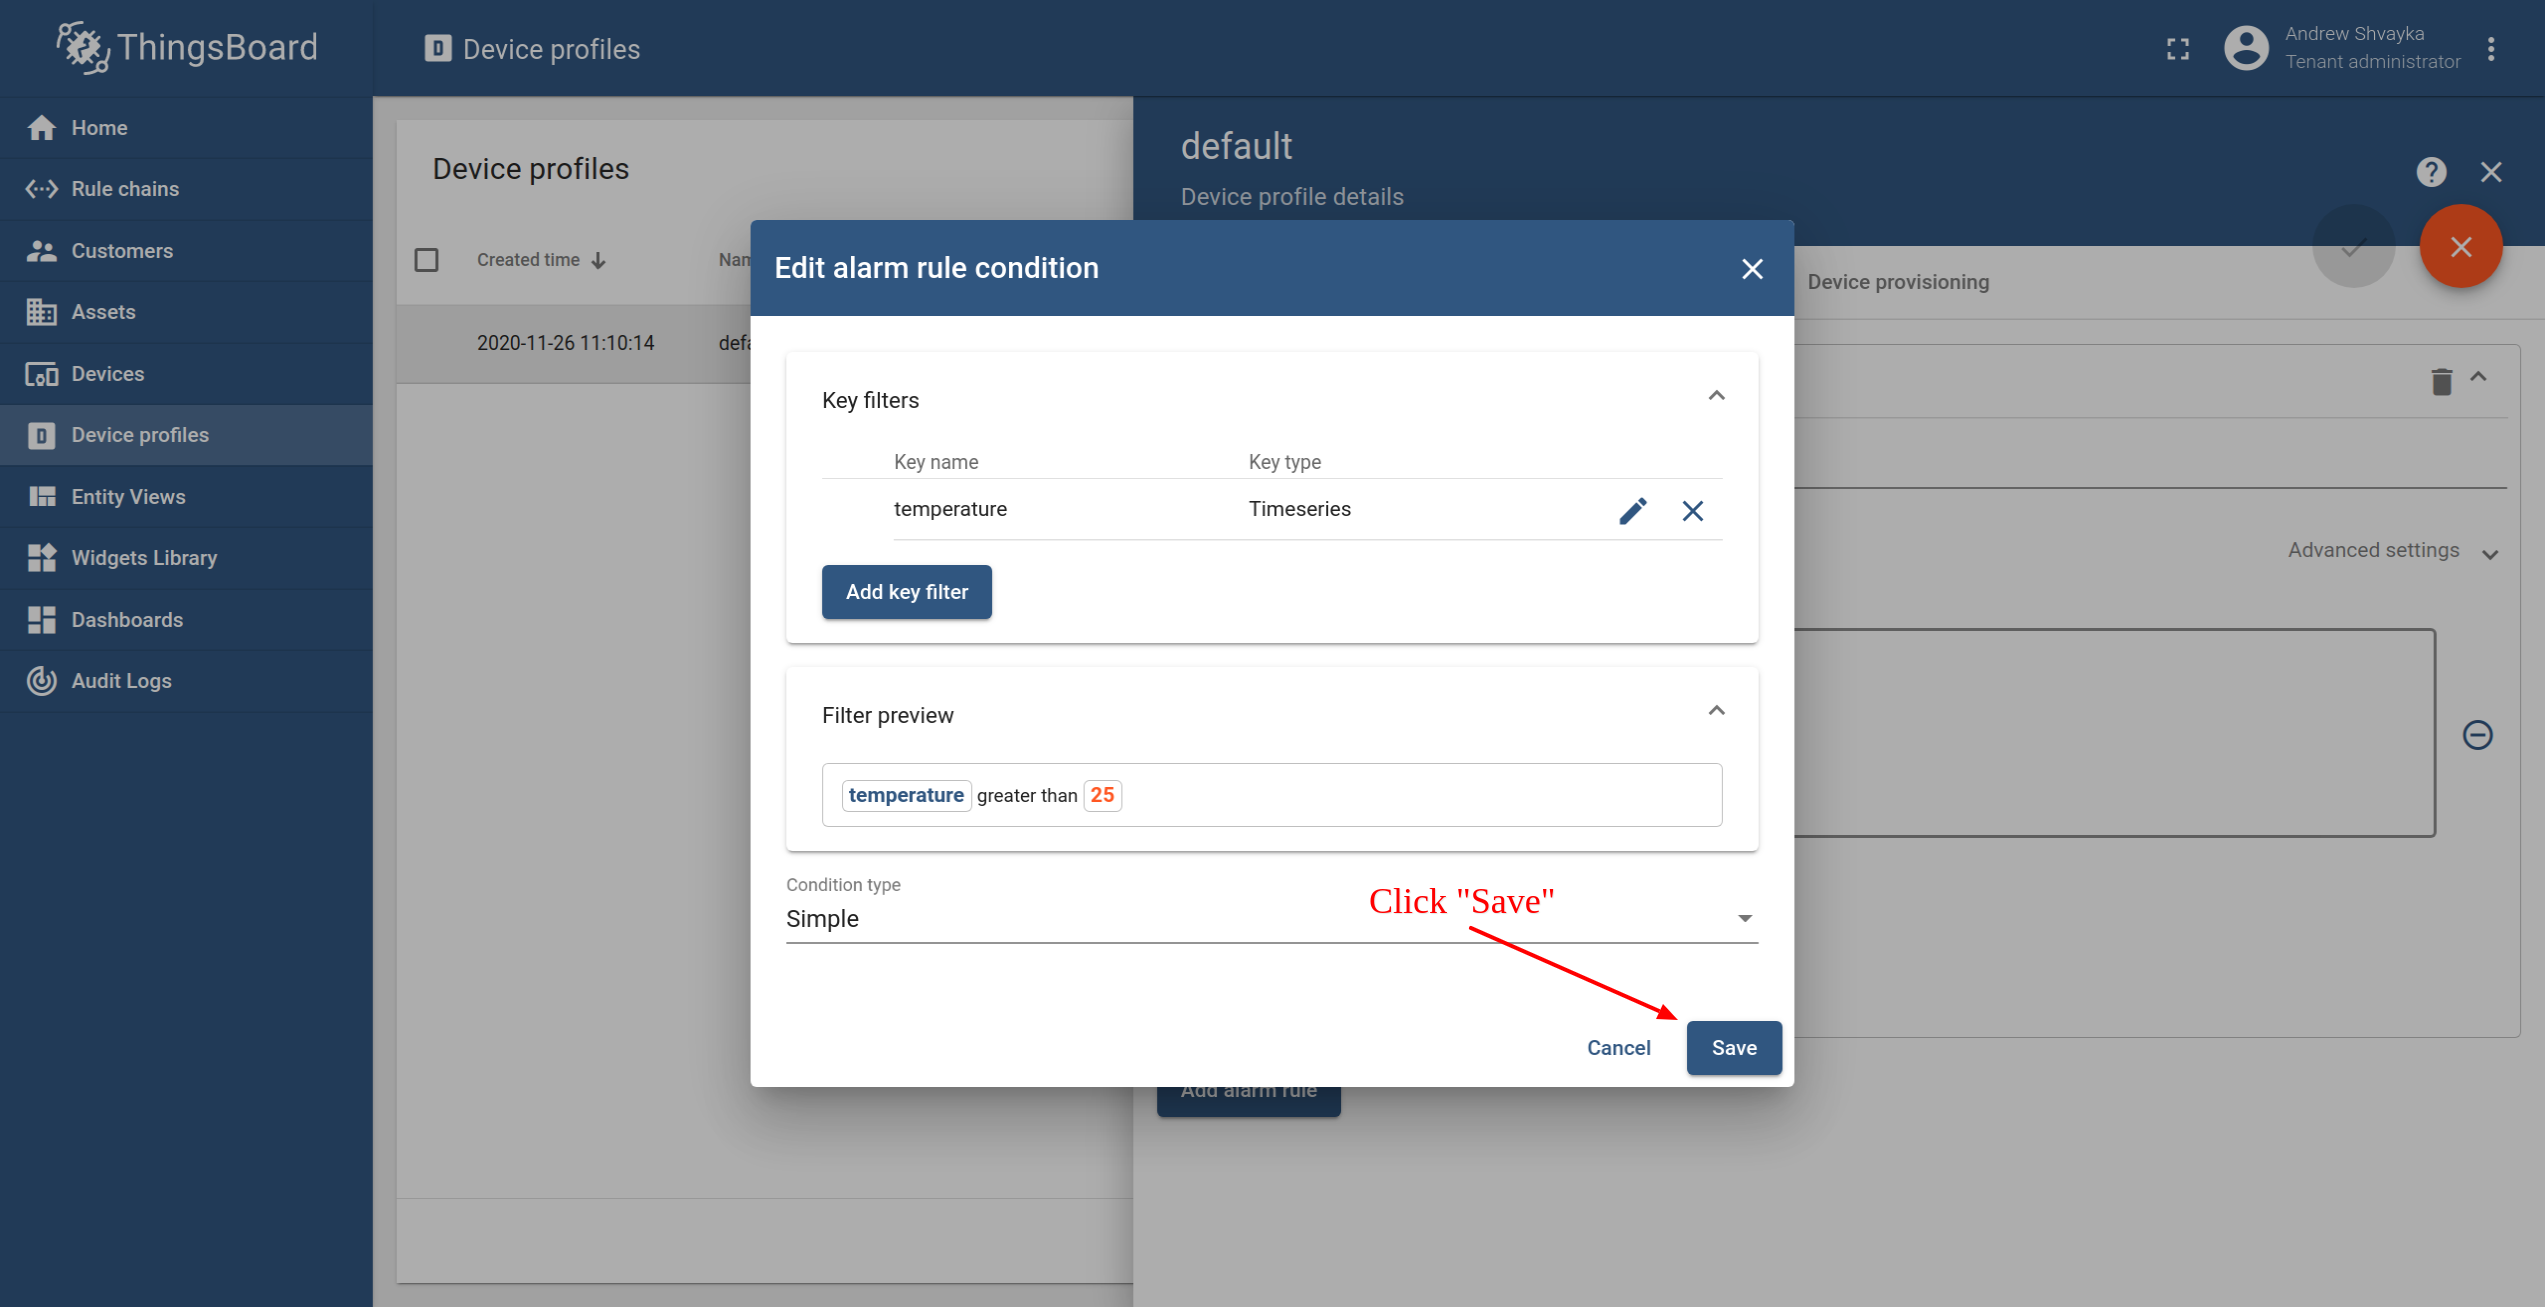
- Clique em "Salvar".
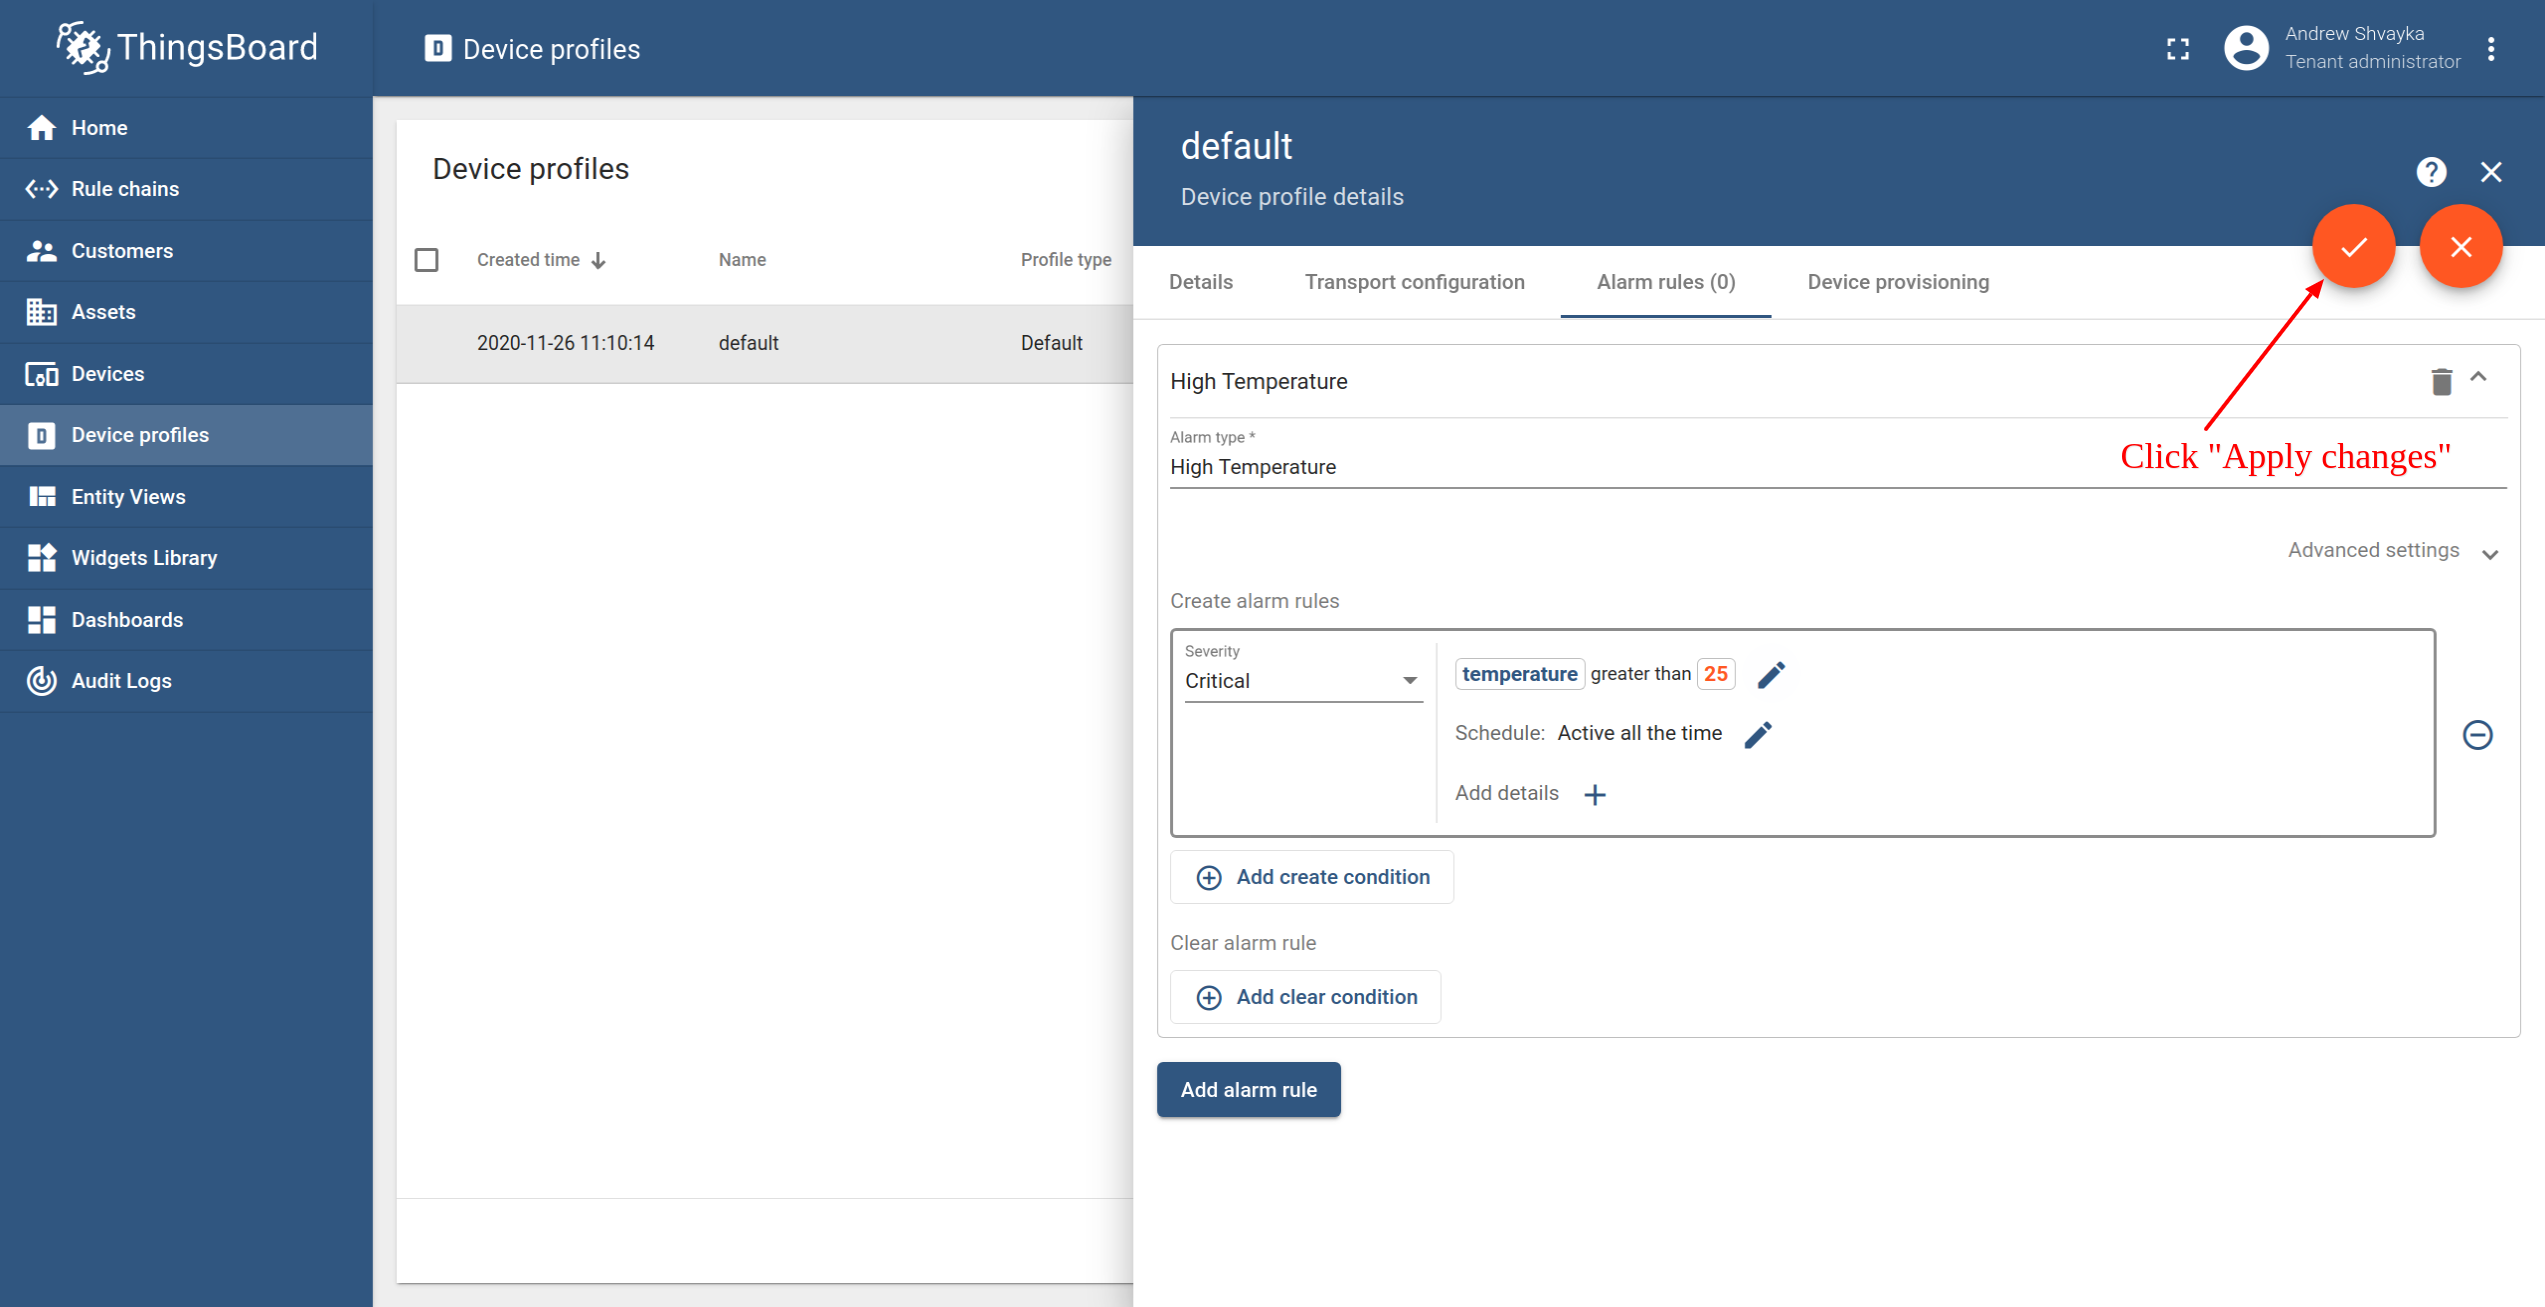
- Por fim, clique em "Aplicar alterações".
Passo 5. Criar alarme
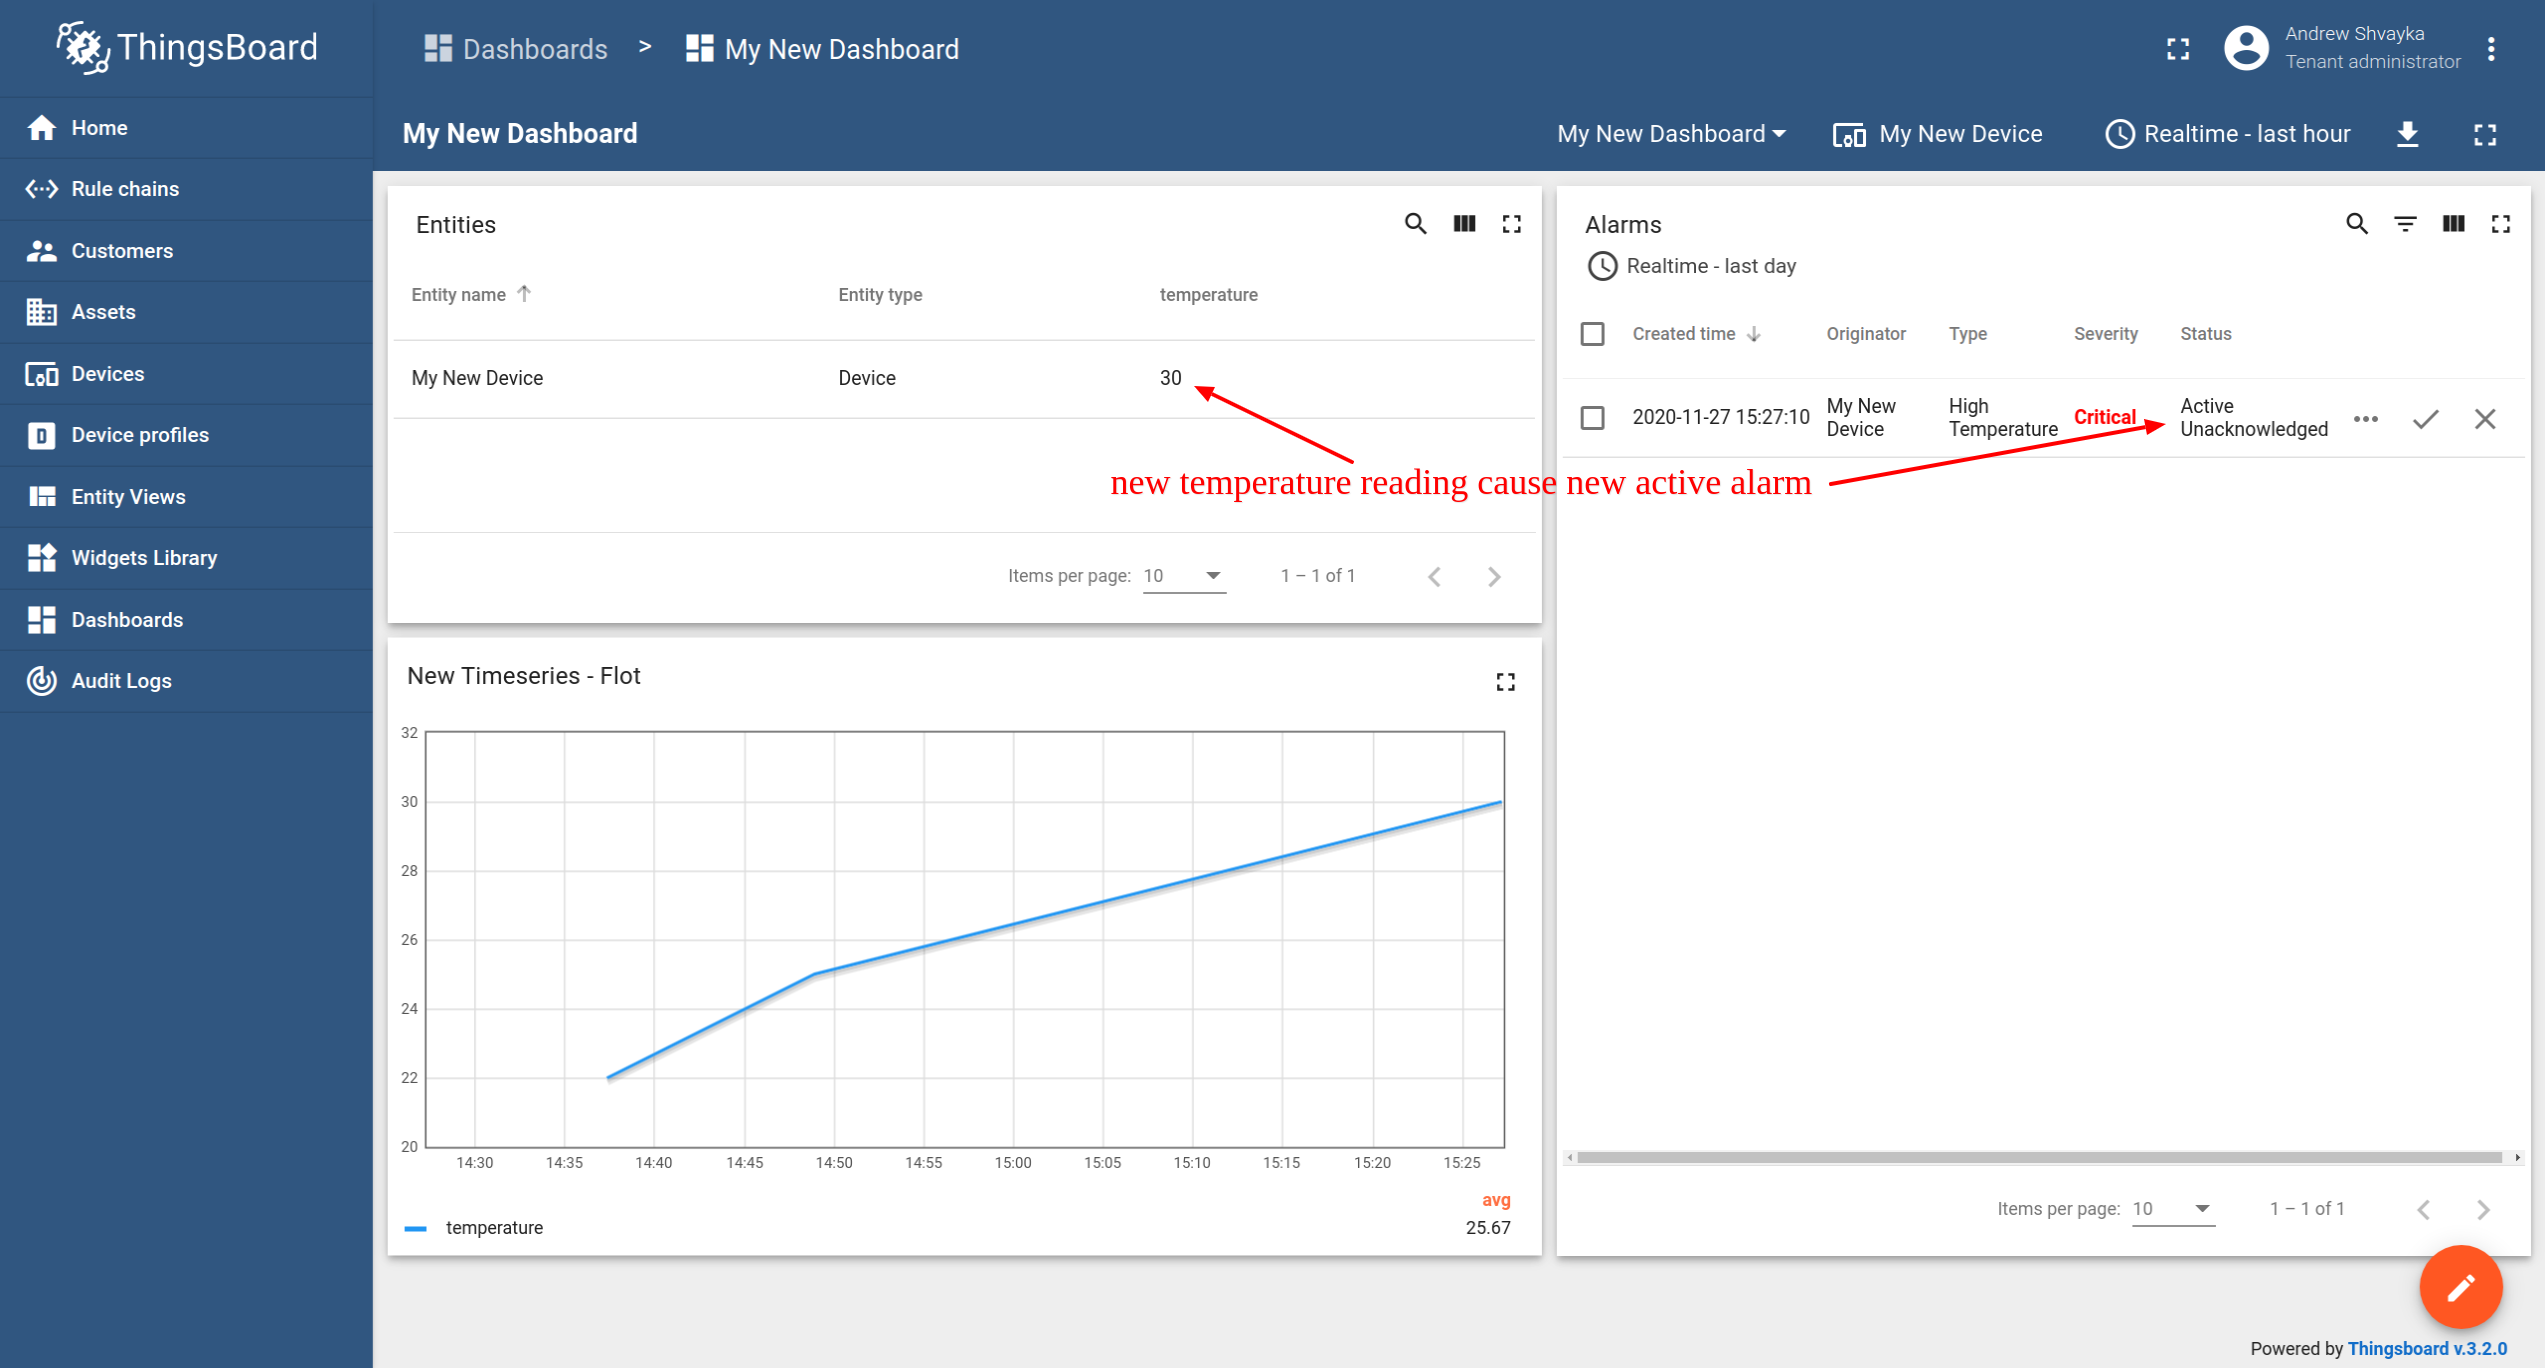
Now our alarm rule is active (see Step 4), and we should send new telemetry on behalf of the device (see Step 2) to trigger the alarm. Observe que o valor da temperatura deve ser 26 ou mais para acionar o alarme. Once we send a new temperature reading, we should immediately see a new alarm on our dashboard.
- Observe que a nova telemetria de temperatura causa um novo alarme ativo.
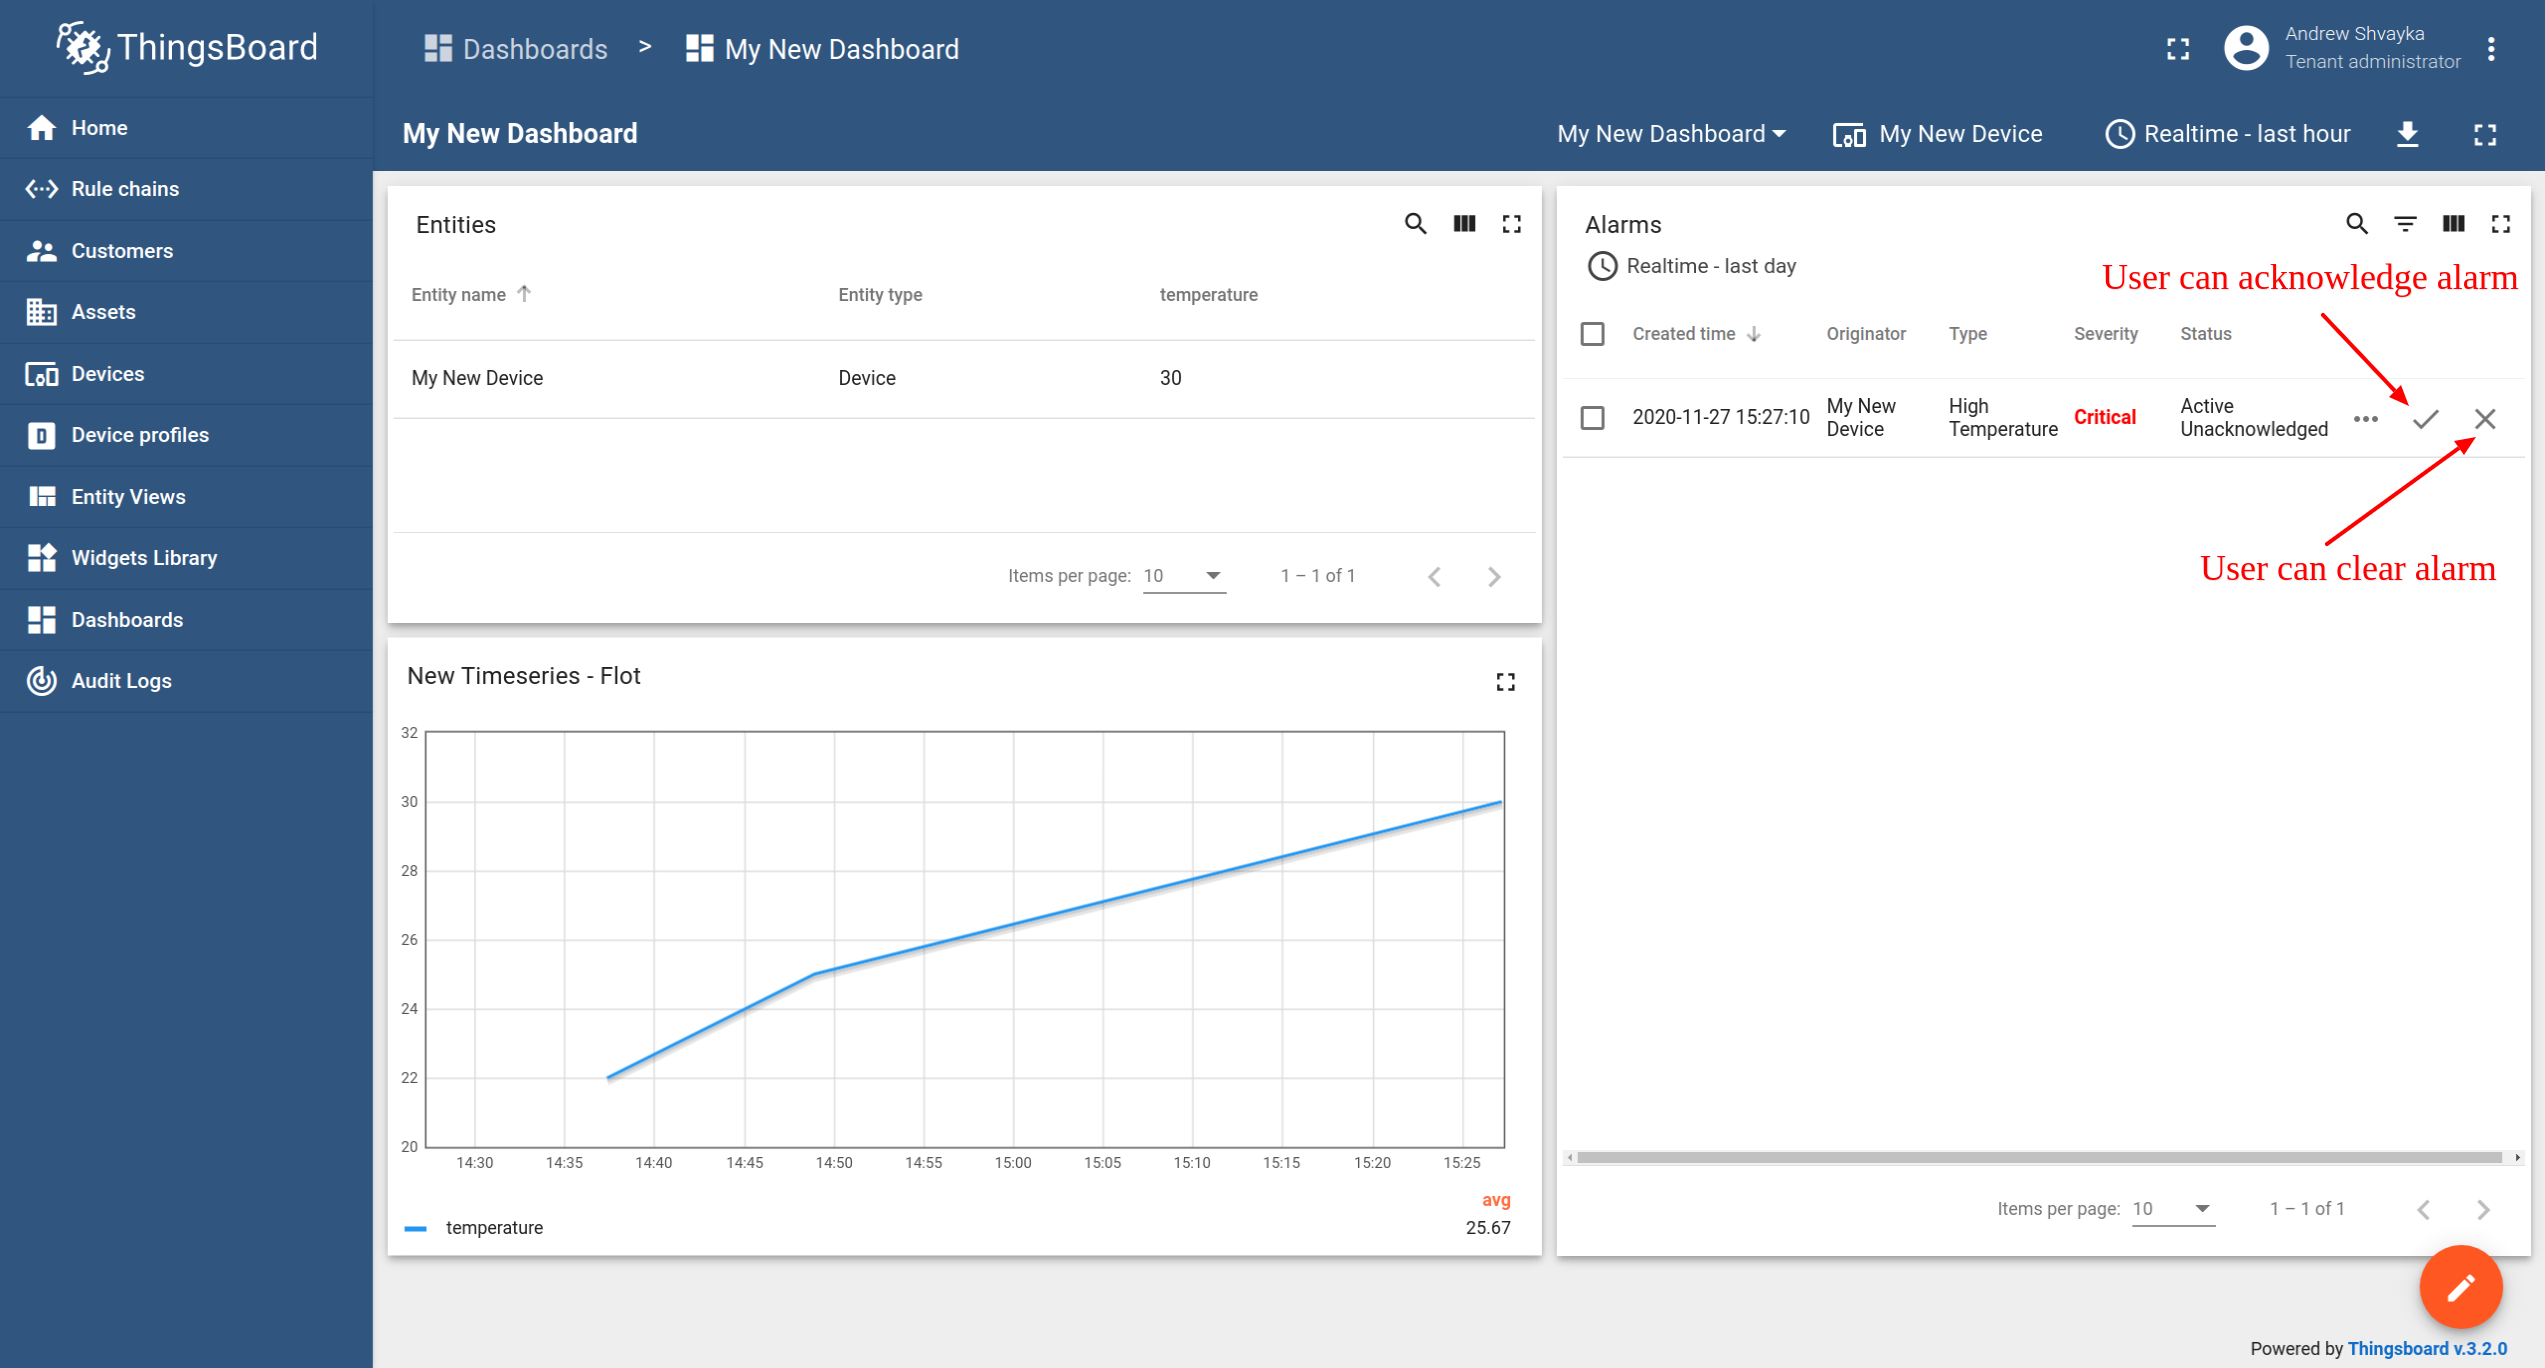
- O usuário pode reconhecer e limpar os alarmes.
Passo 6: Notificação de Alarmes
É muito fácil configurar notificações por email ou sms para alarmes.Recomendamos revisar a regra exemplos e documentação sobre alarm notifications.
Note: At the moment ThingsBoard supports AWS SNS and Twilio to send SMS. Both services are non-free and require you to create an account. No entanto, você pode integrar com outros gateways SMS / EMAIL usando chamada REST API < / a> nó.
Step 7. Assign Device and Dashboard to Customer
One of the most important ThingsBoard features is the ability to assign Dashboards to Customers. You may assign different devices to different customers. Then, you may create a Dashboard(s) and assign it to multiple customers. Each customer user will see his own devices and will not be able to see devices or any other data that belongs to a different customer.
Passo 7.1 Criar clientes
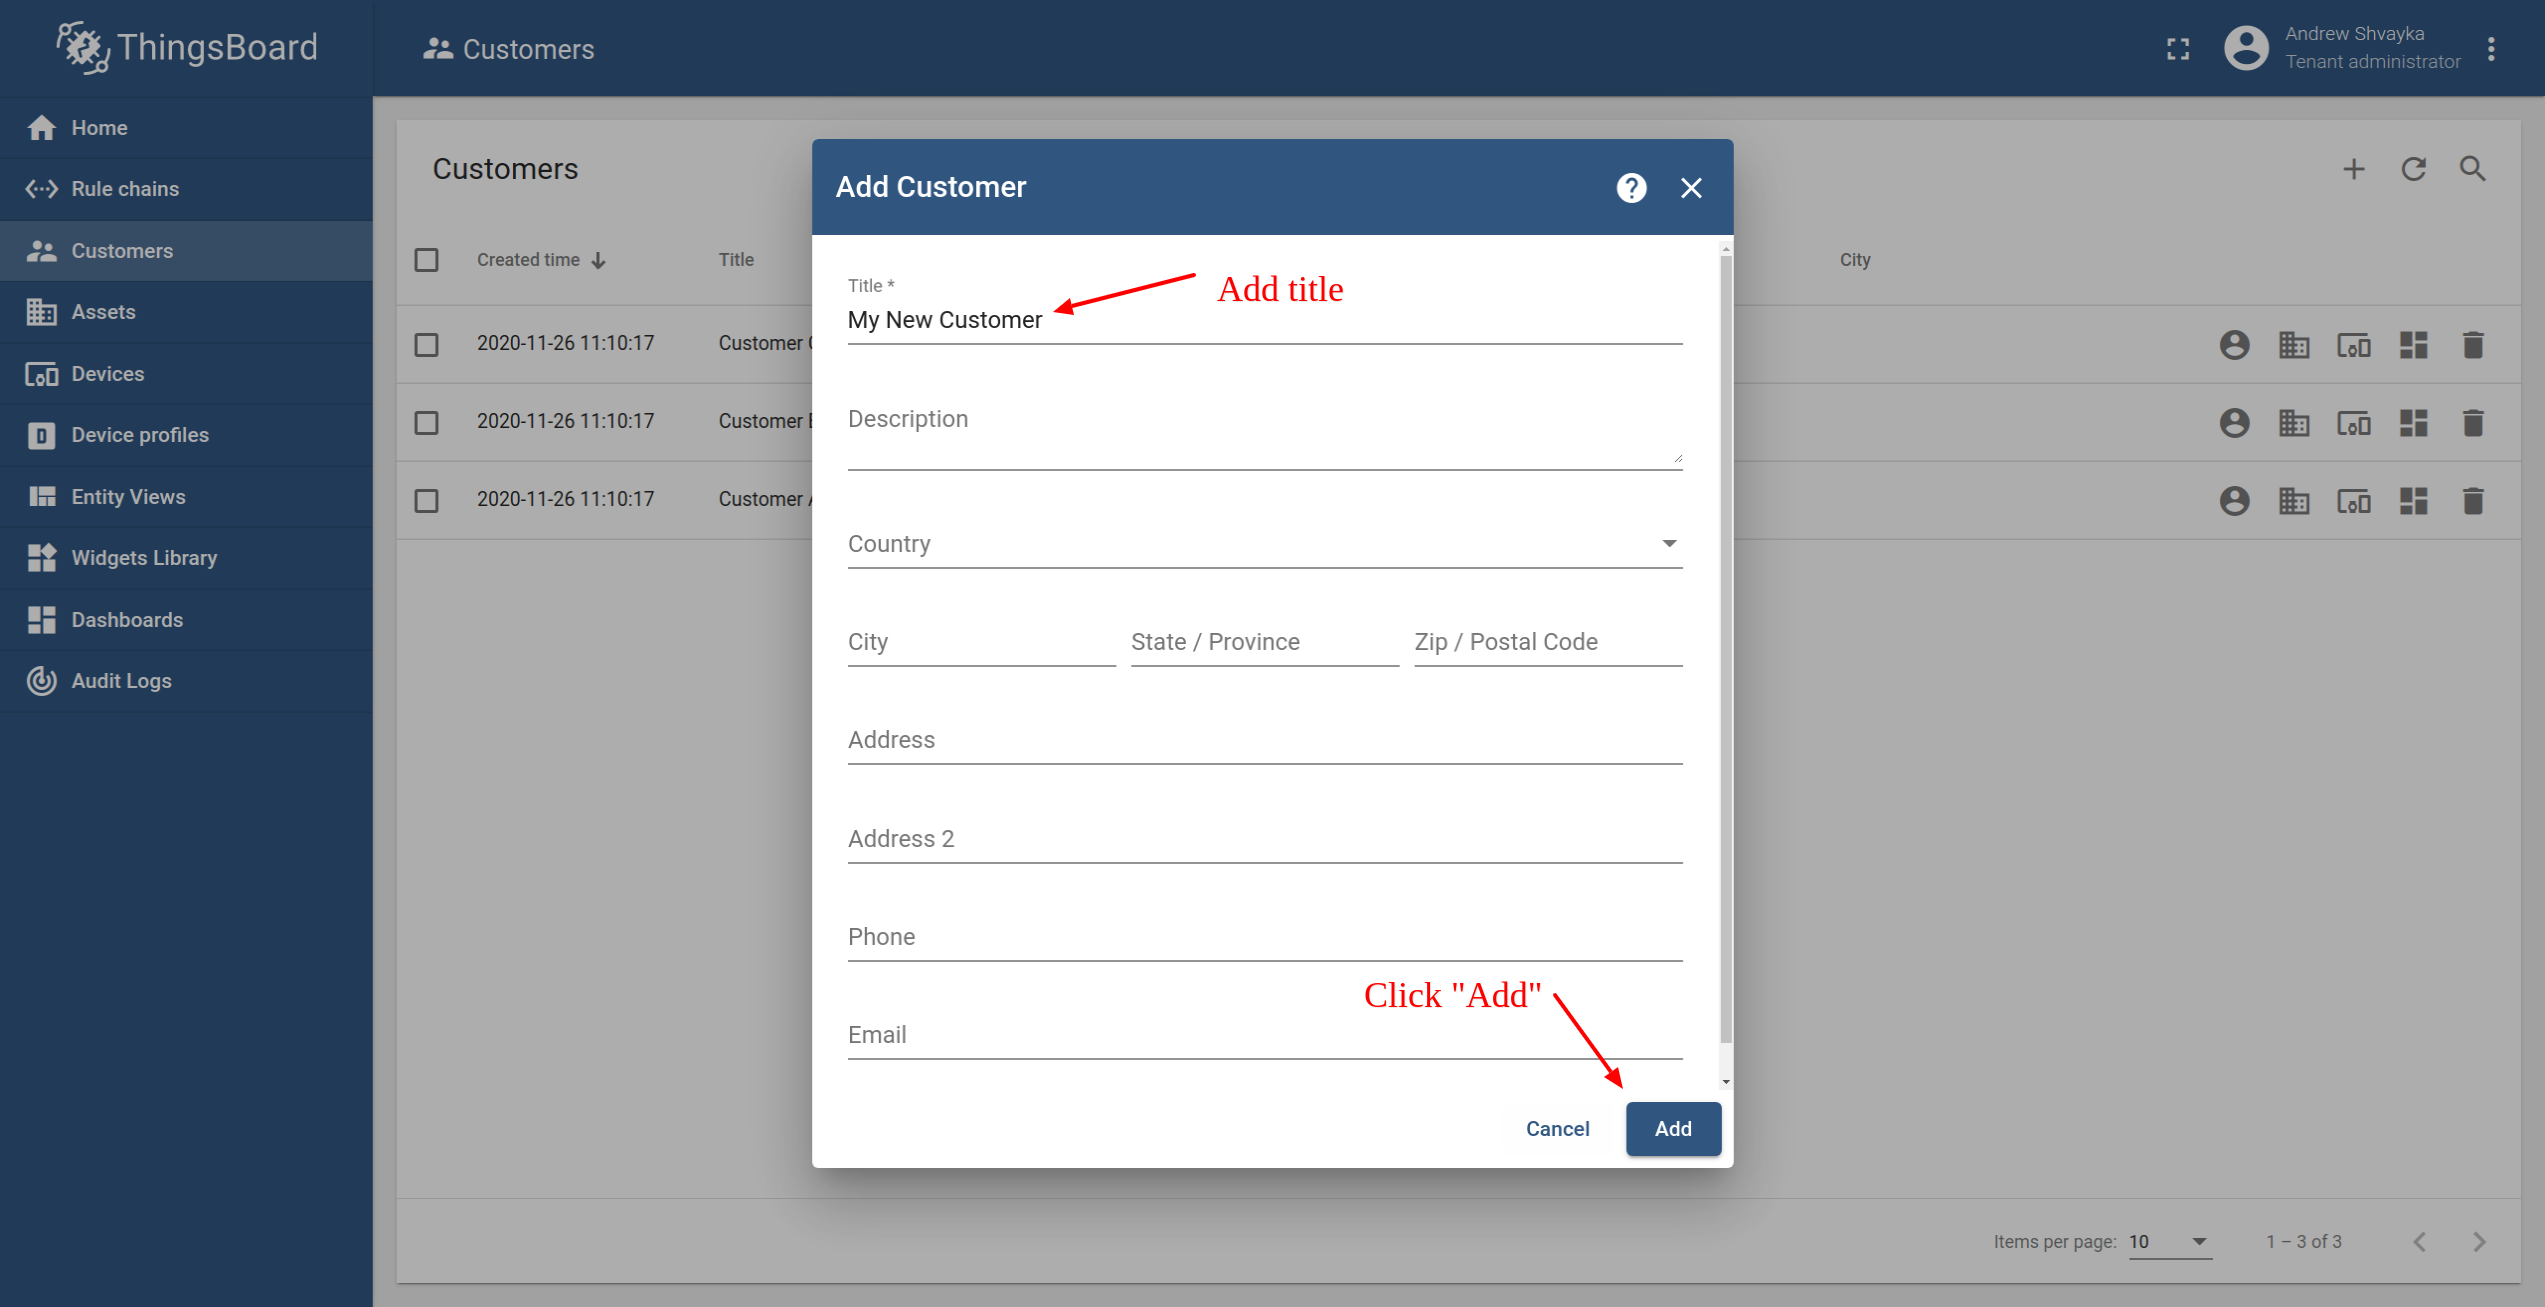
Vamos criar um cliente com o título “Meu novo cliente”. Por favor, veja as instruções abaixo:
- Navigate to the Customers page.
- Adicione um nome e clique em adicionar.
- Visualize o cliente adicionado.


Step 7.2 Assign device to Customer
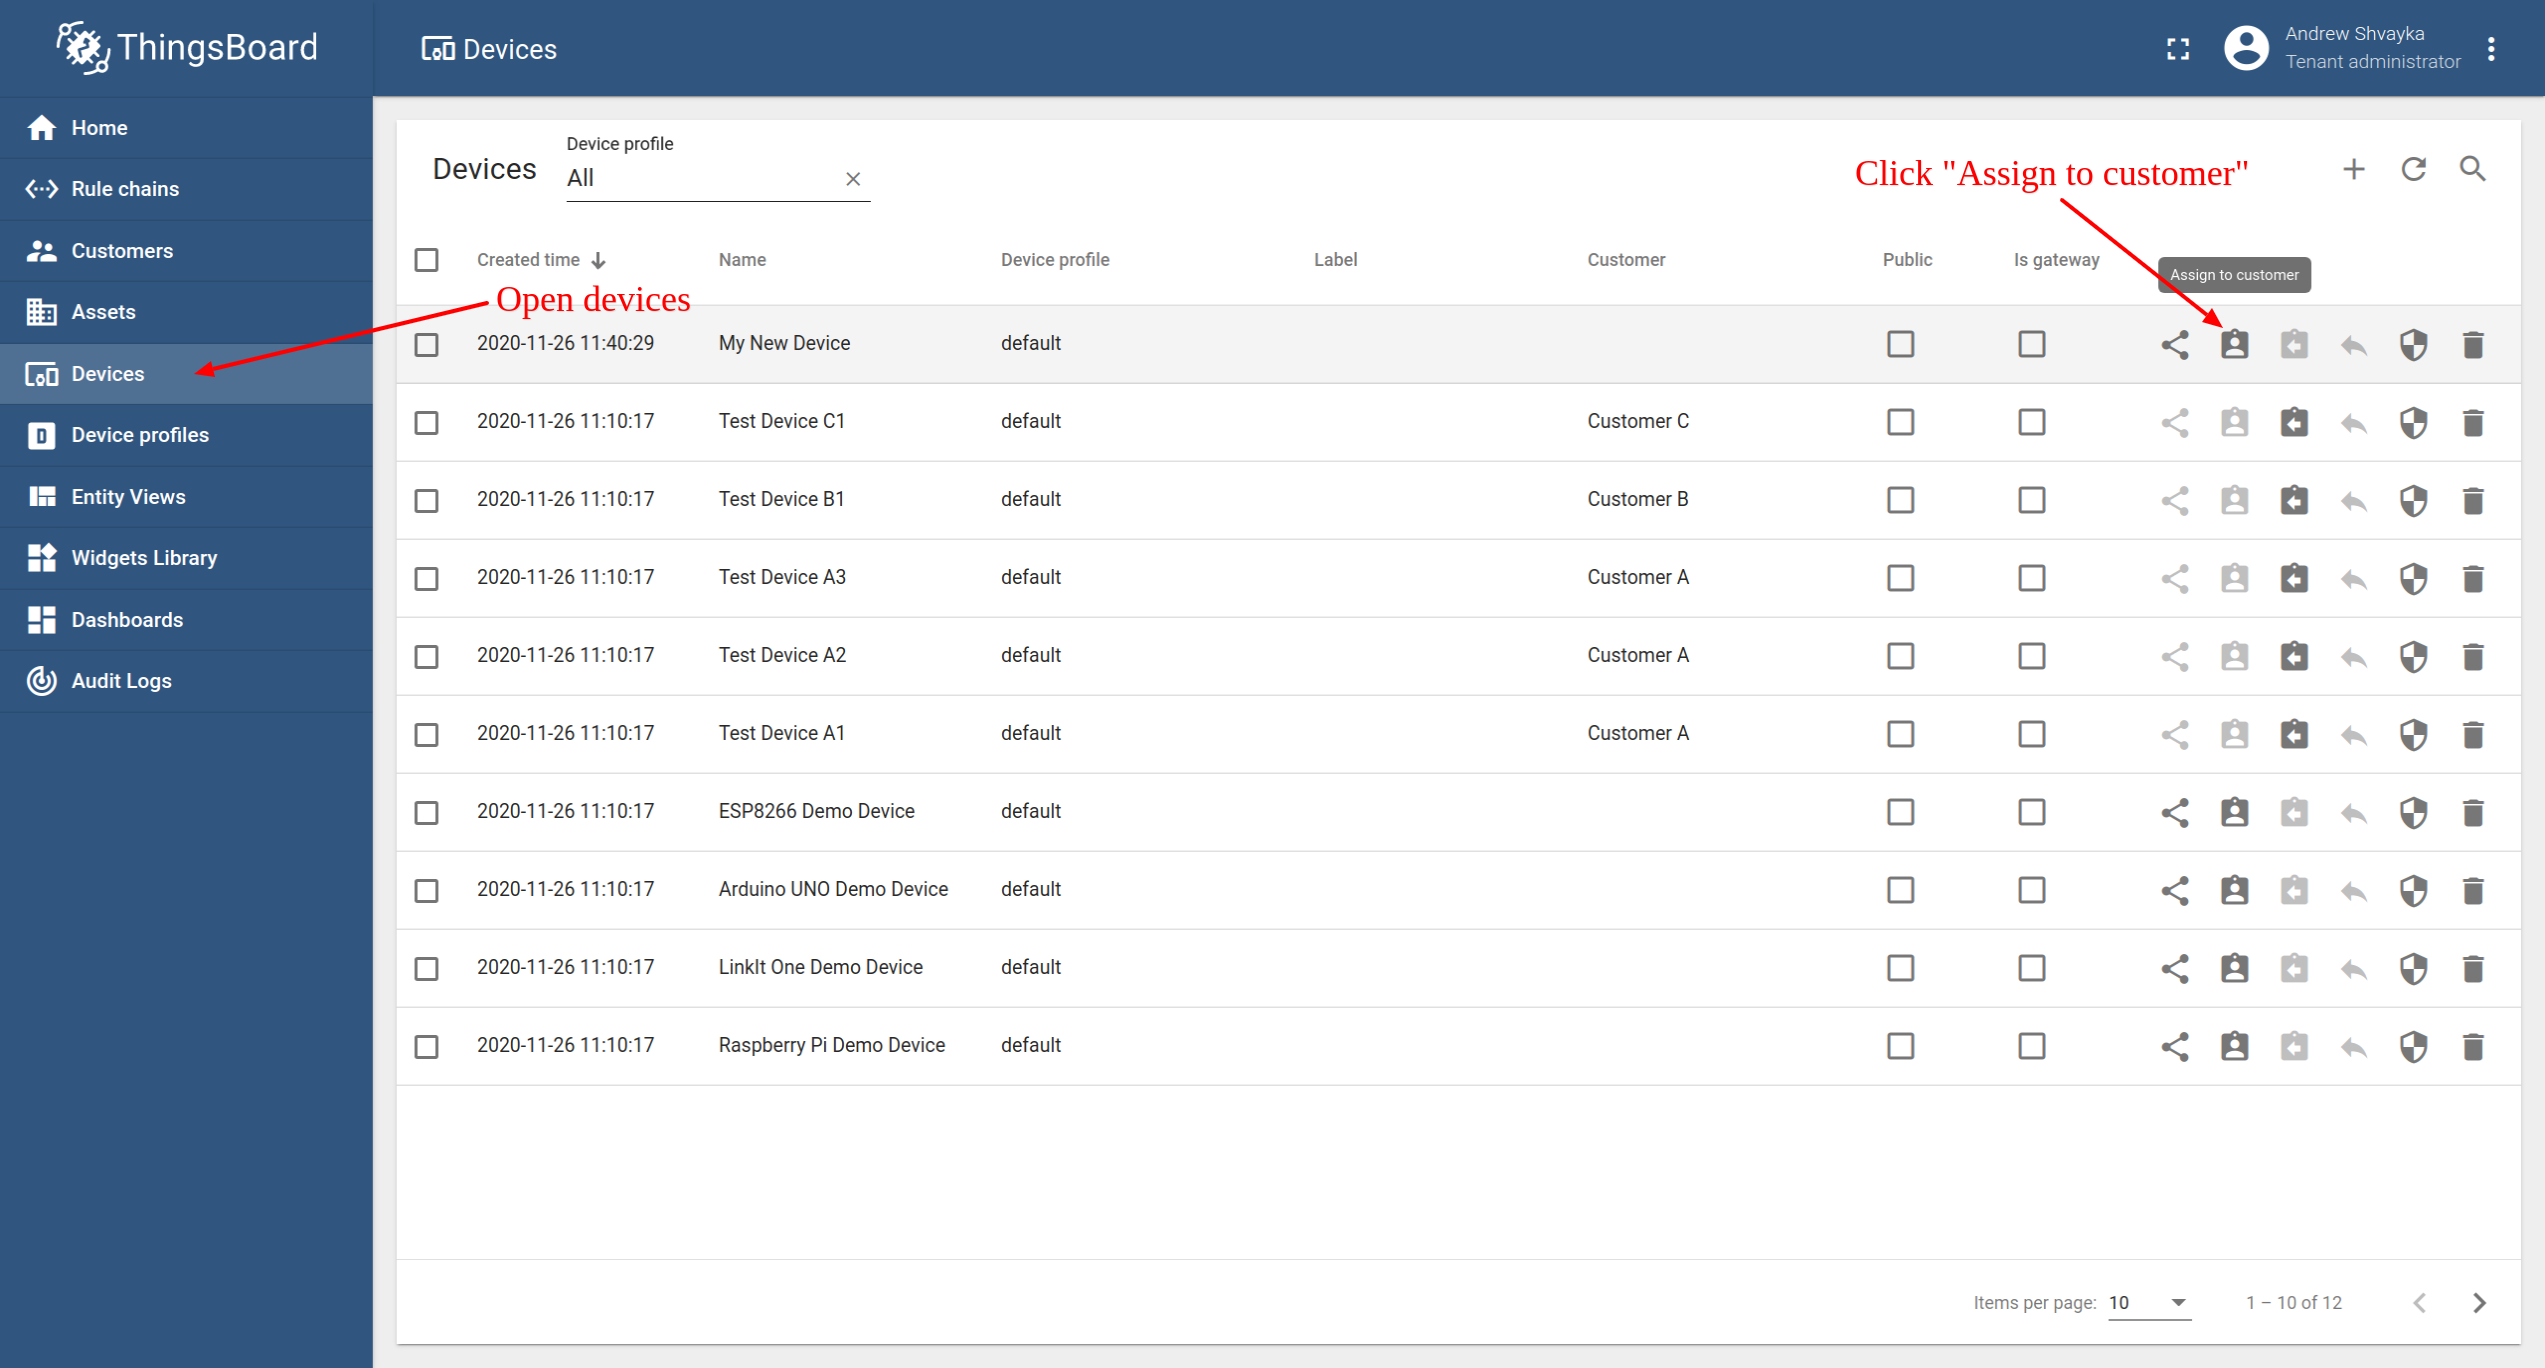
Let’s assign device to the Customer. The Customer users will have ability to read and write telemetry and send commands to devices.
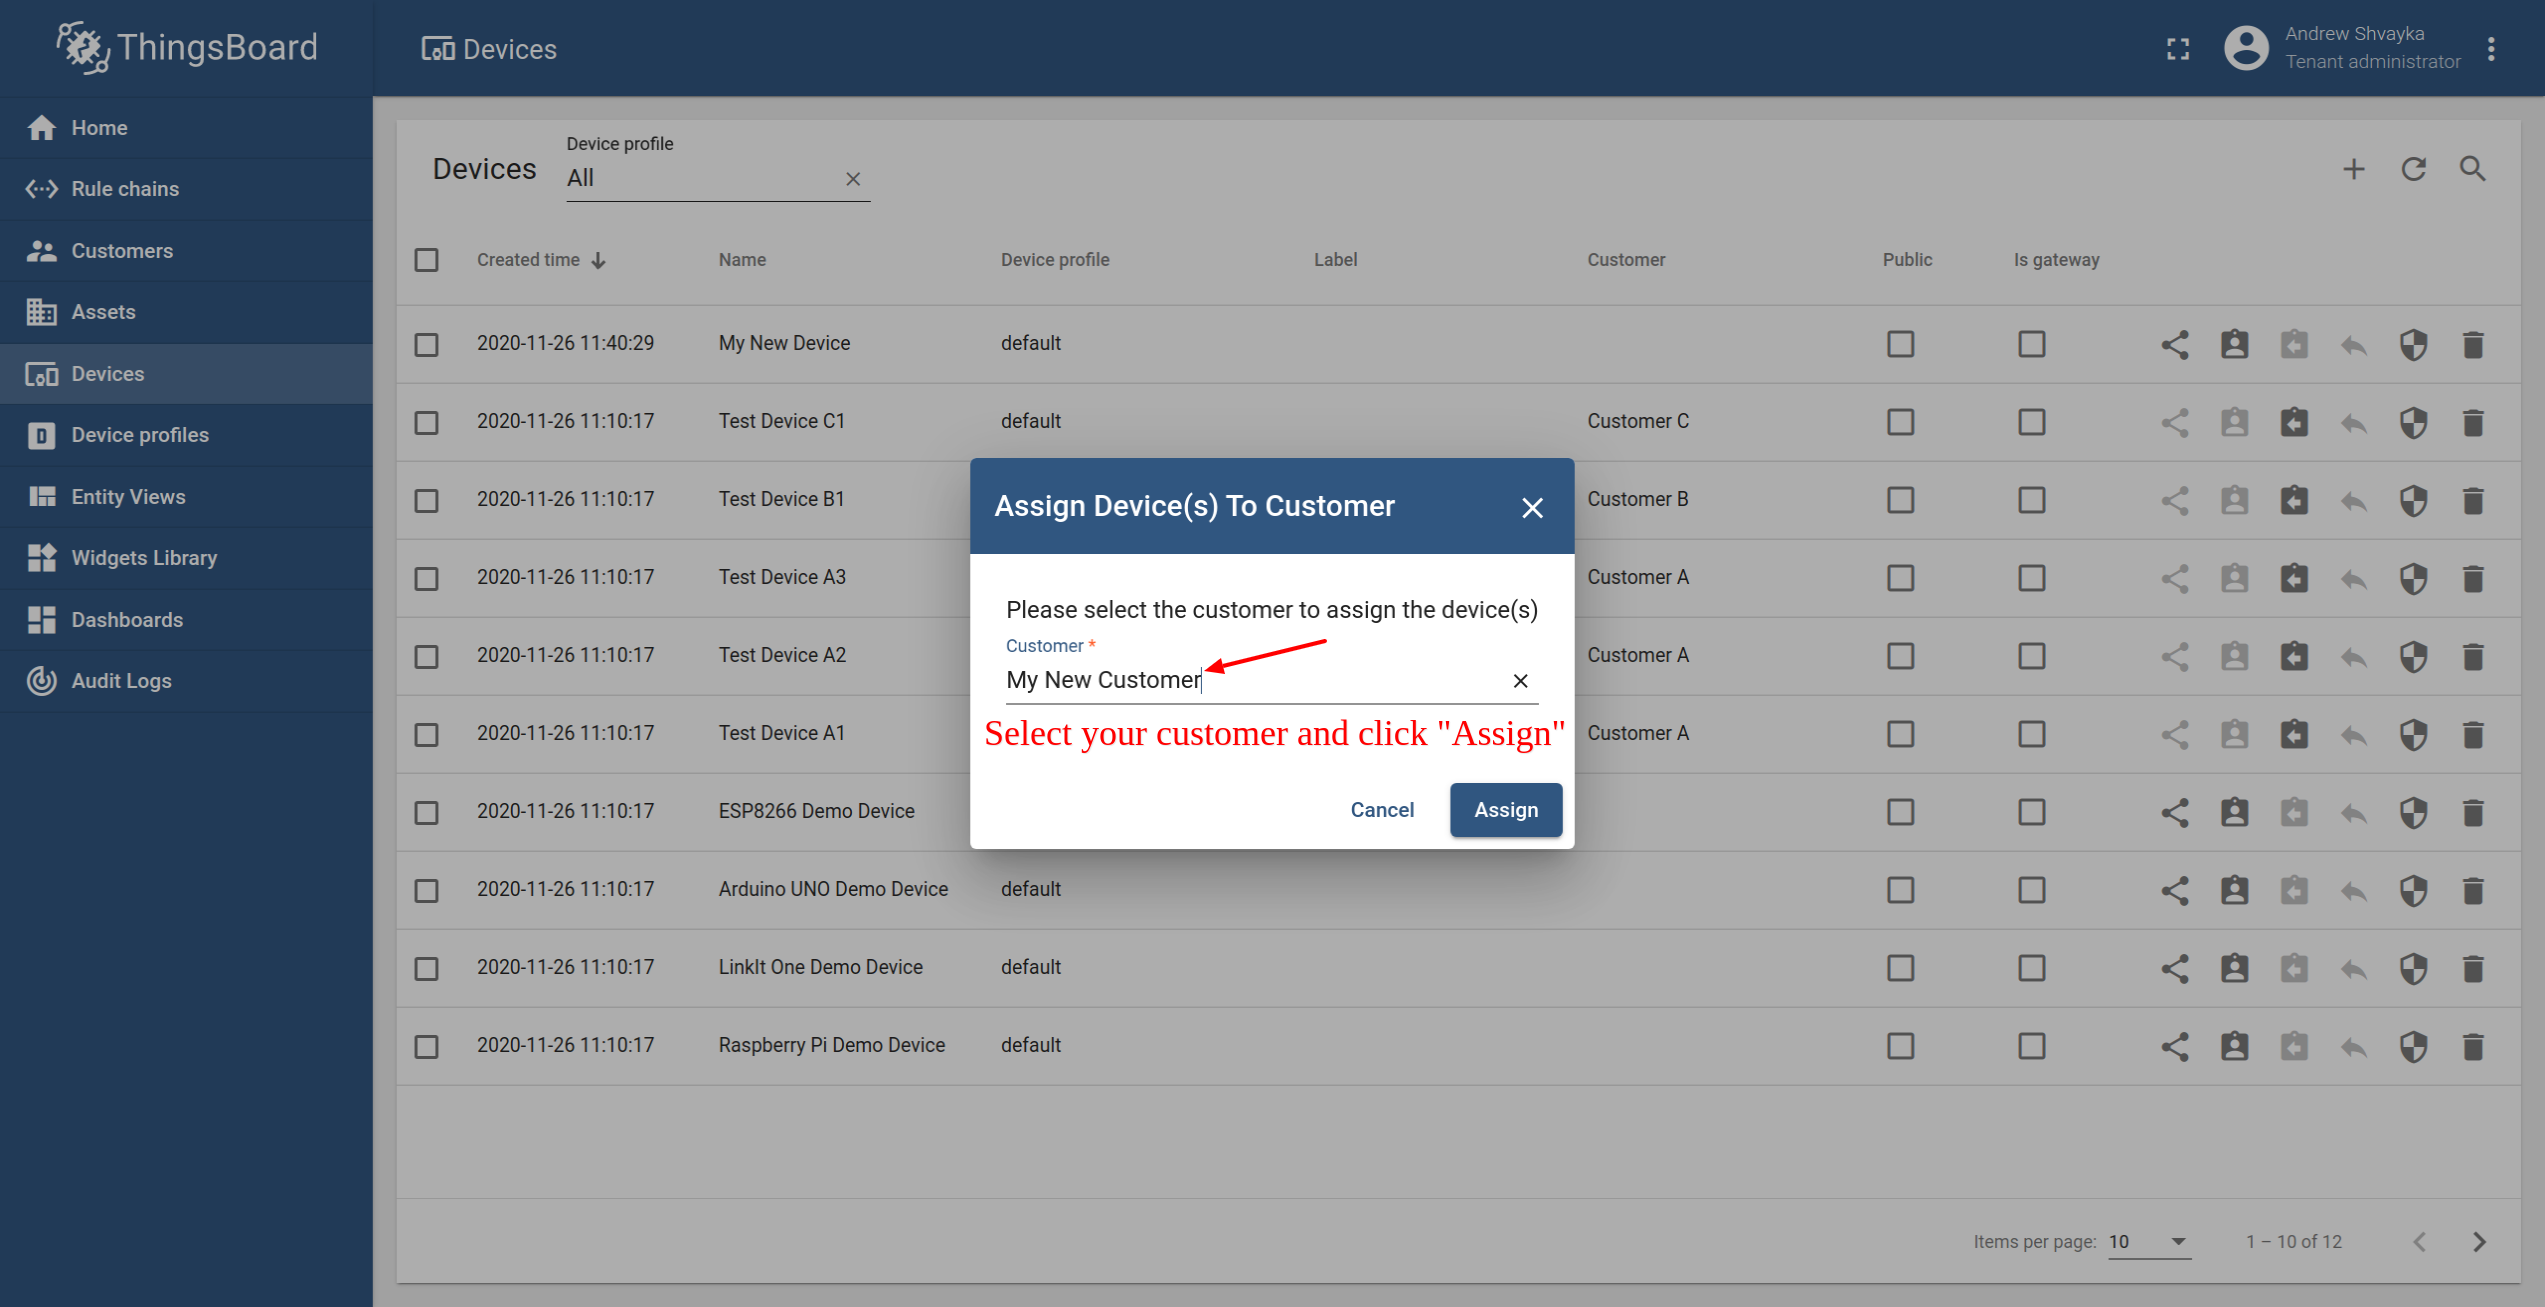
- Open Devices page. Click "Assign to customer" for "My New Device".
- Select "My New Customer" and click "Assign".
Step 7.3 Assign dashboard to Customer
Let’s share our dashboard with the Customer. The Customer users will have read-only access to the Dashboard.
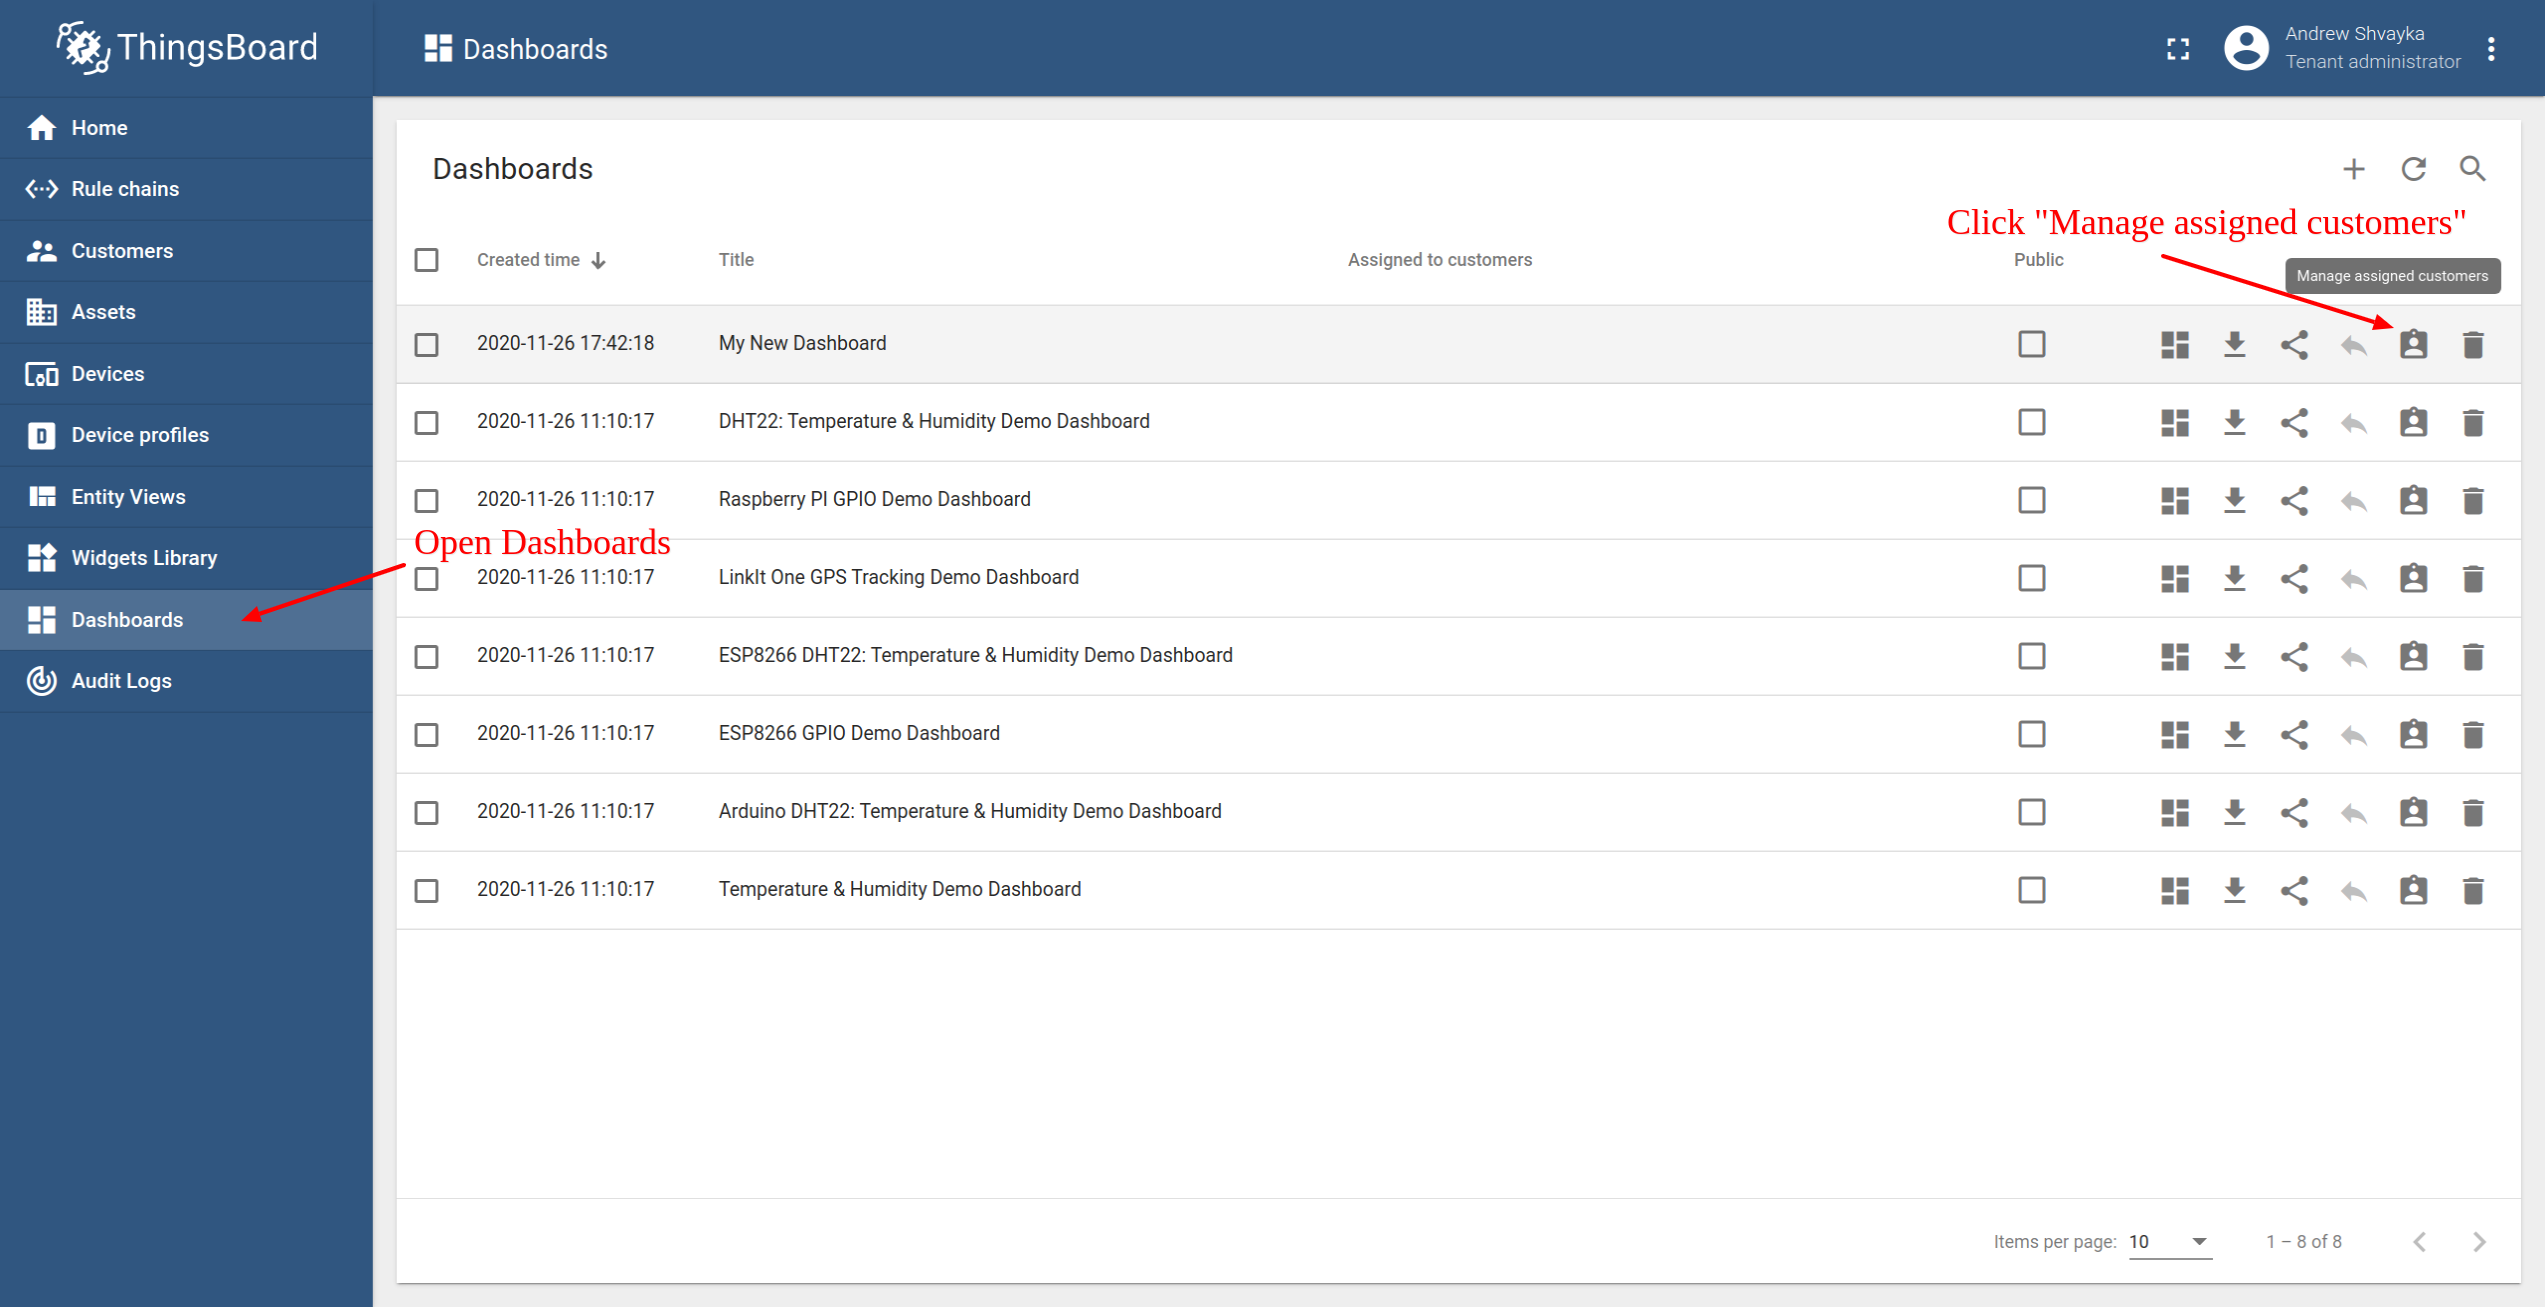
- Open Dashboards. Click "Manage assigned customers".
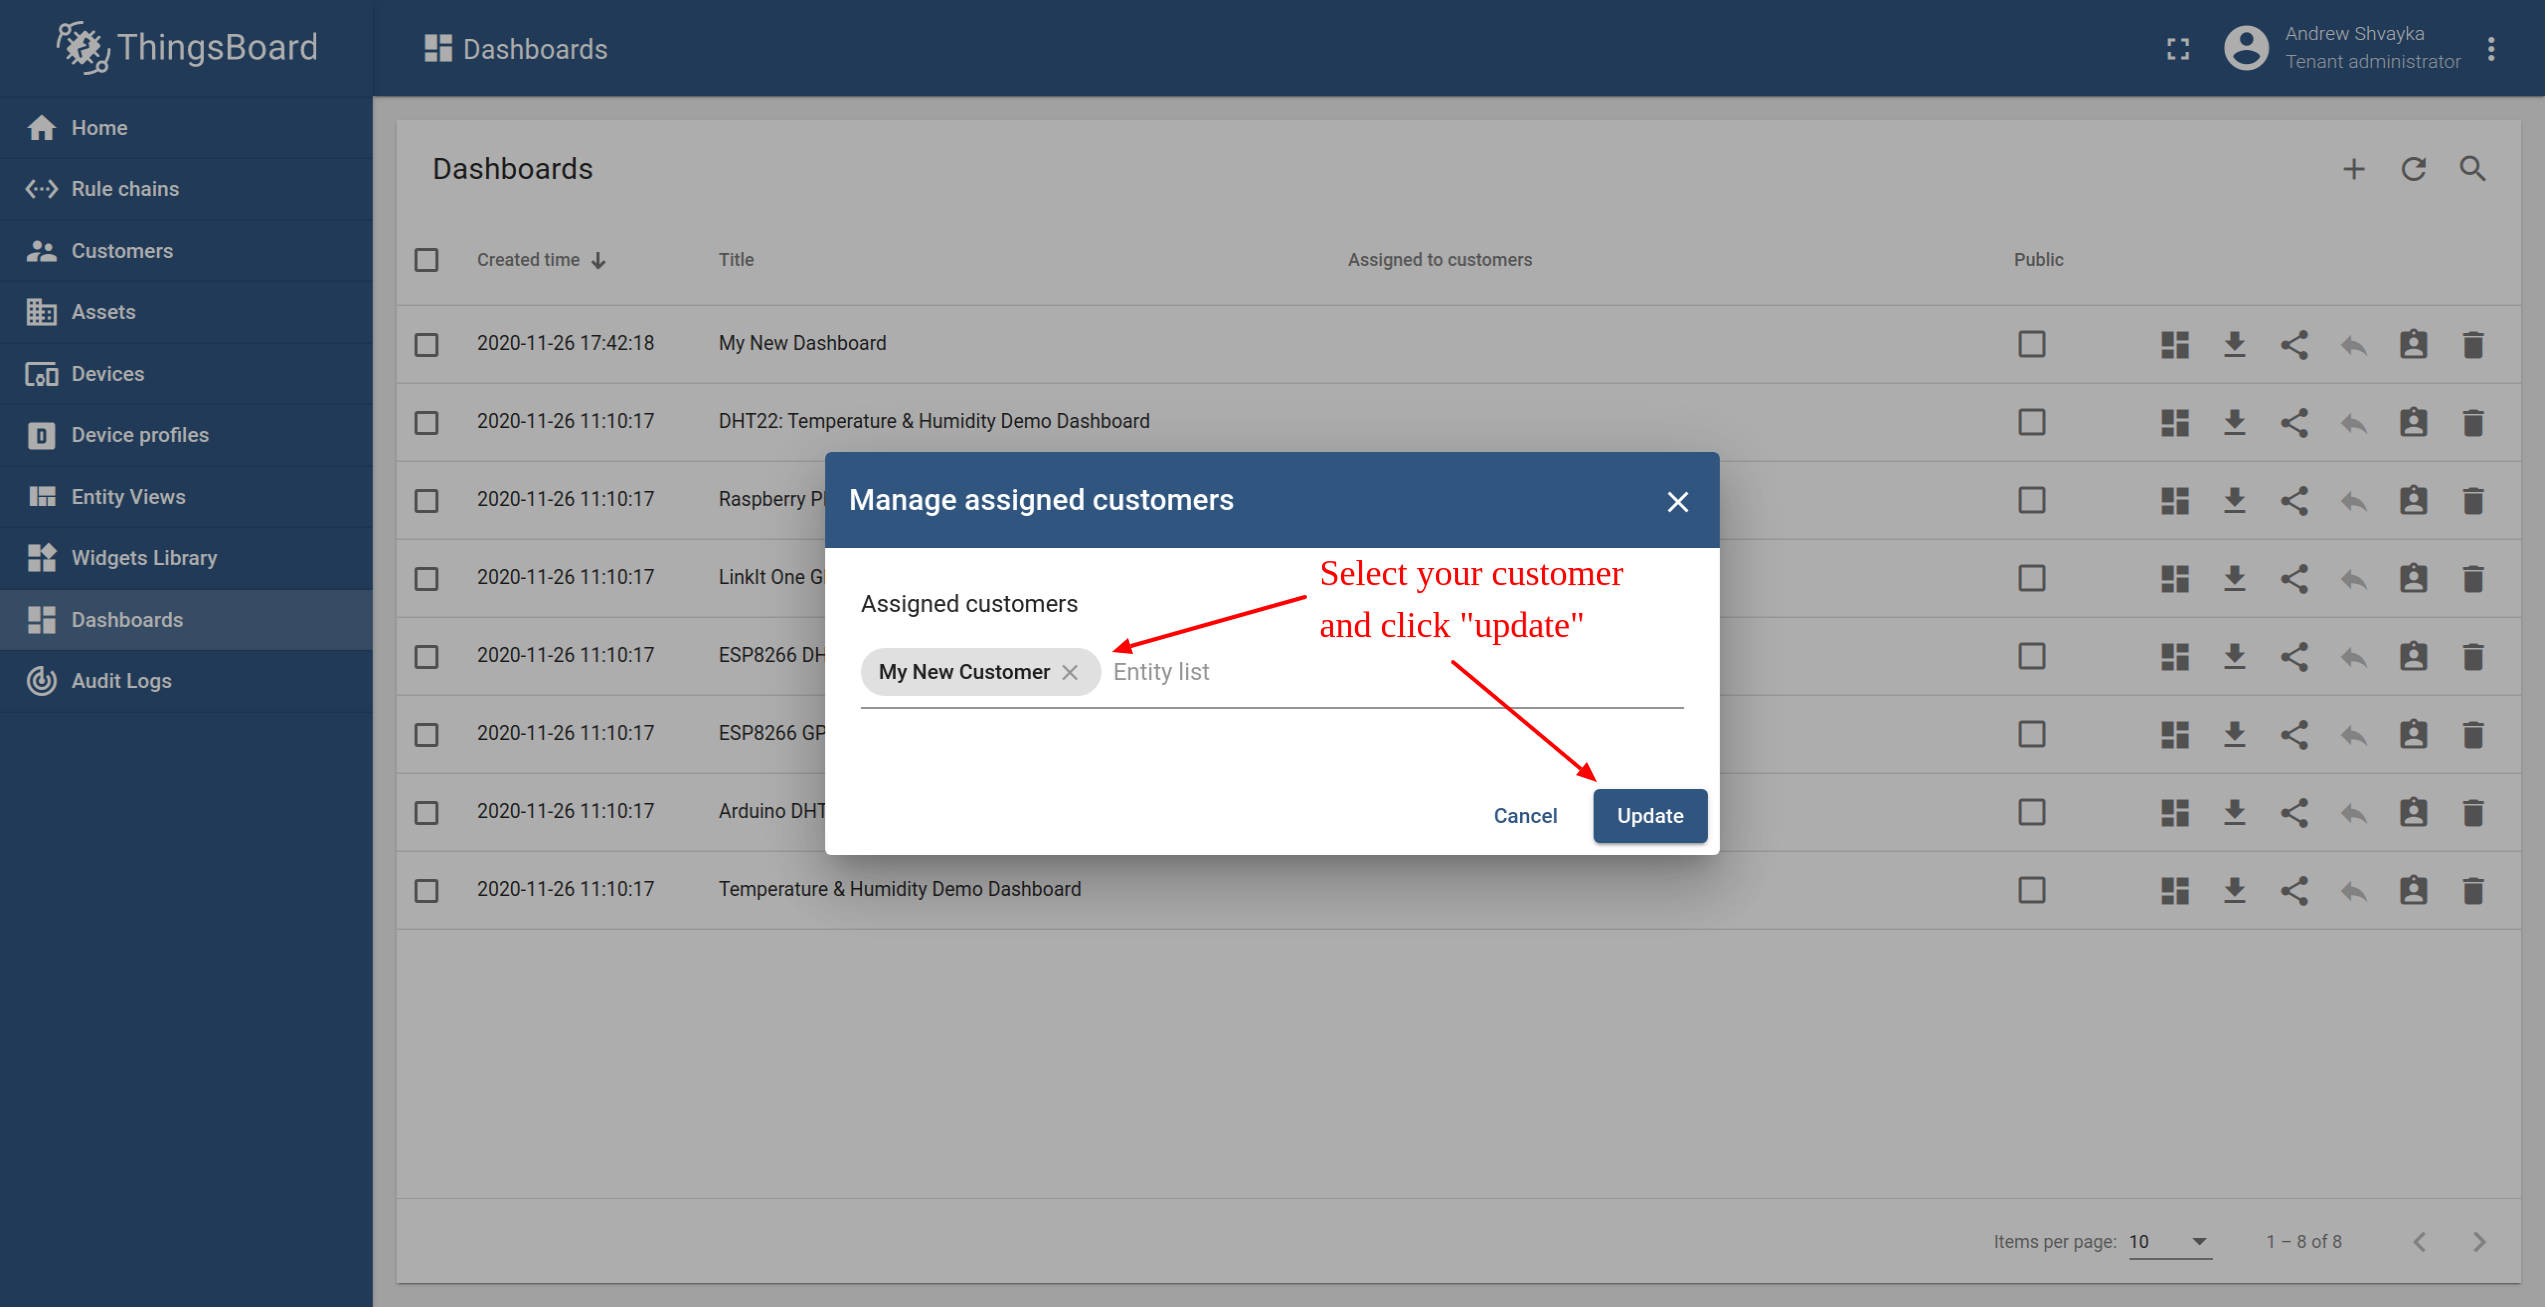
- Select "My New Customer" and click "Update".
Passo 7.4 Criar usuário cliente
Finally, let’s create a user that will belong to the customer and will have read-only access to the dashboard and the device. You may optionally configure the dashboard to appear just after user login to the platform web UI.
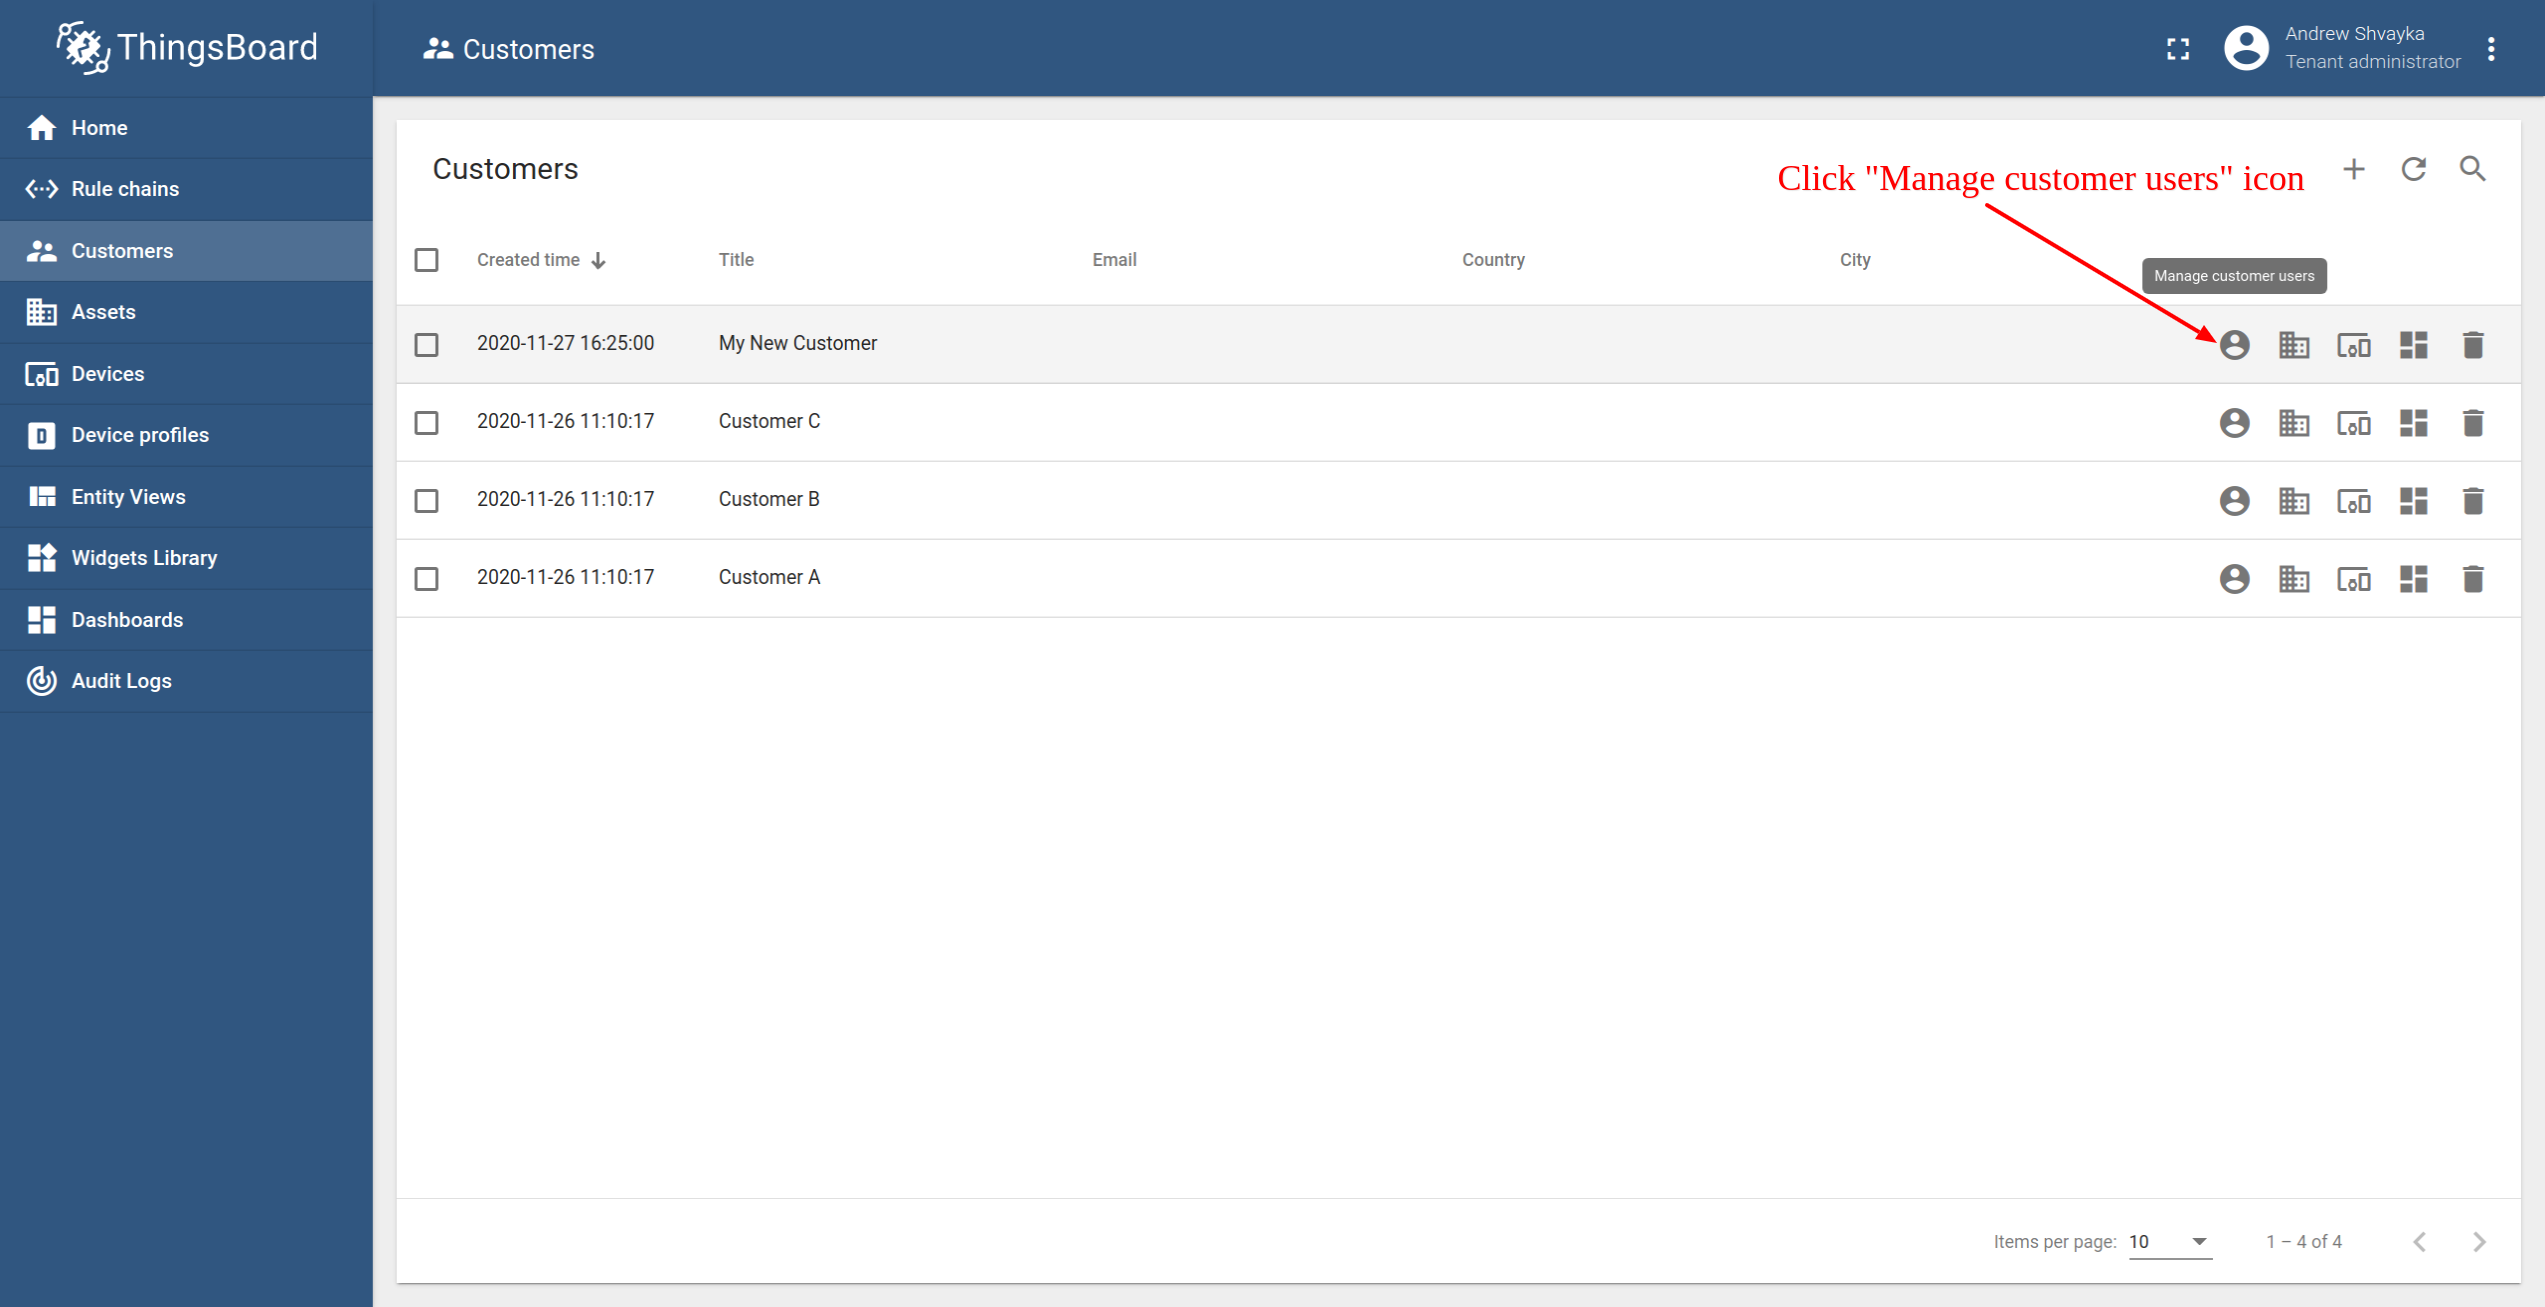
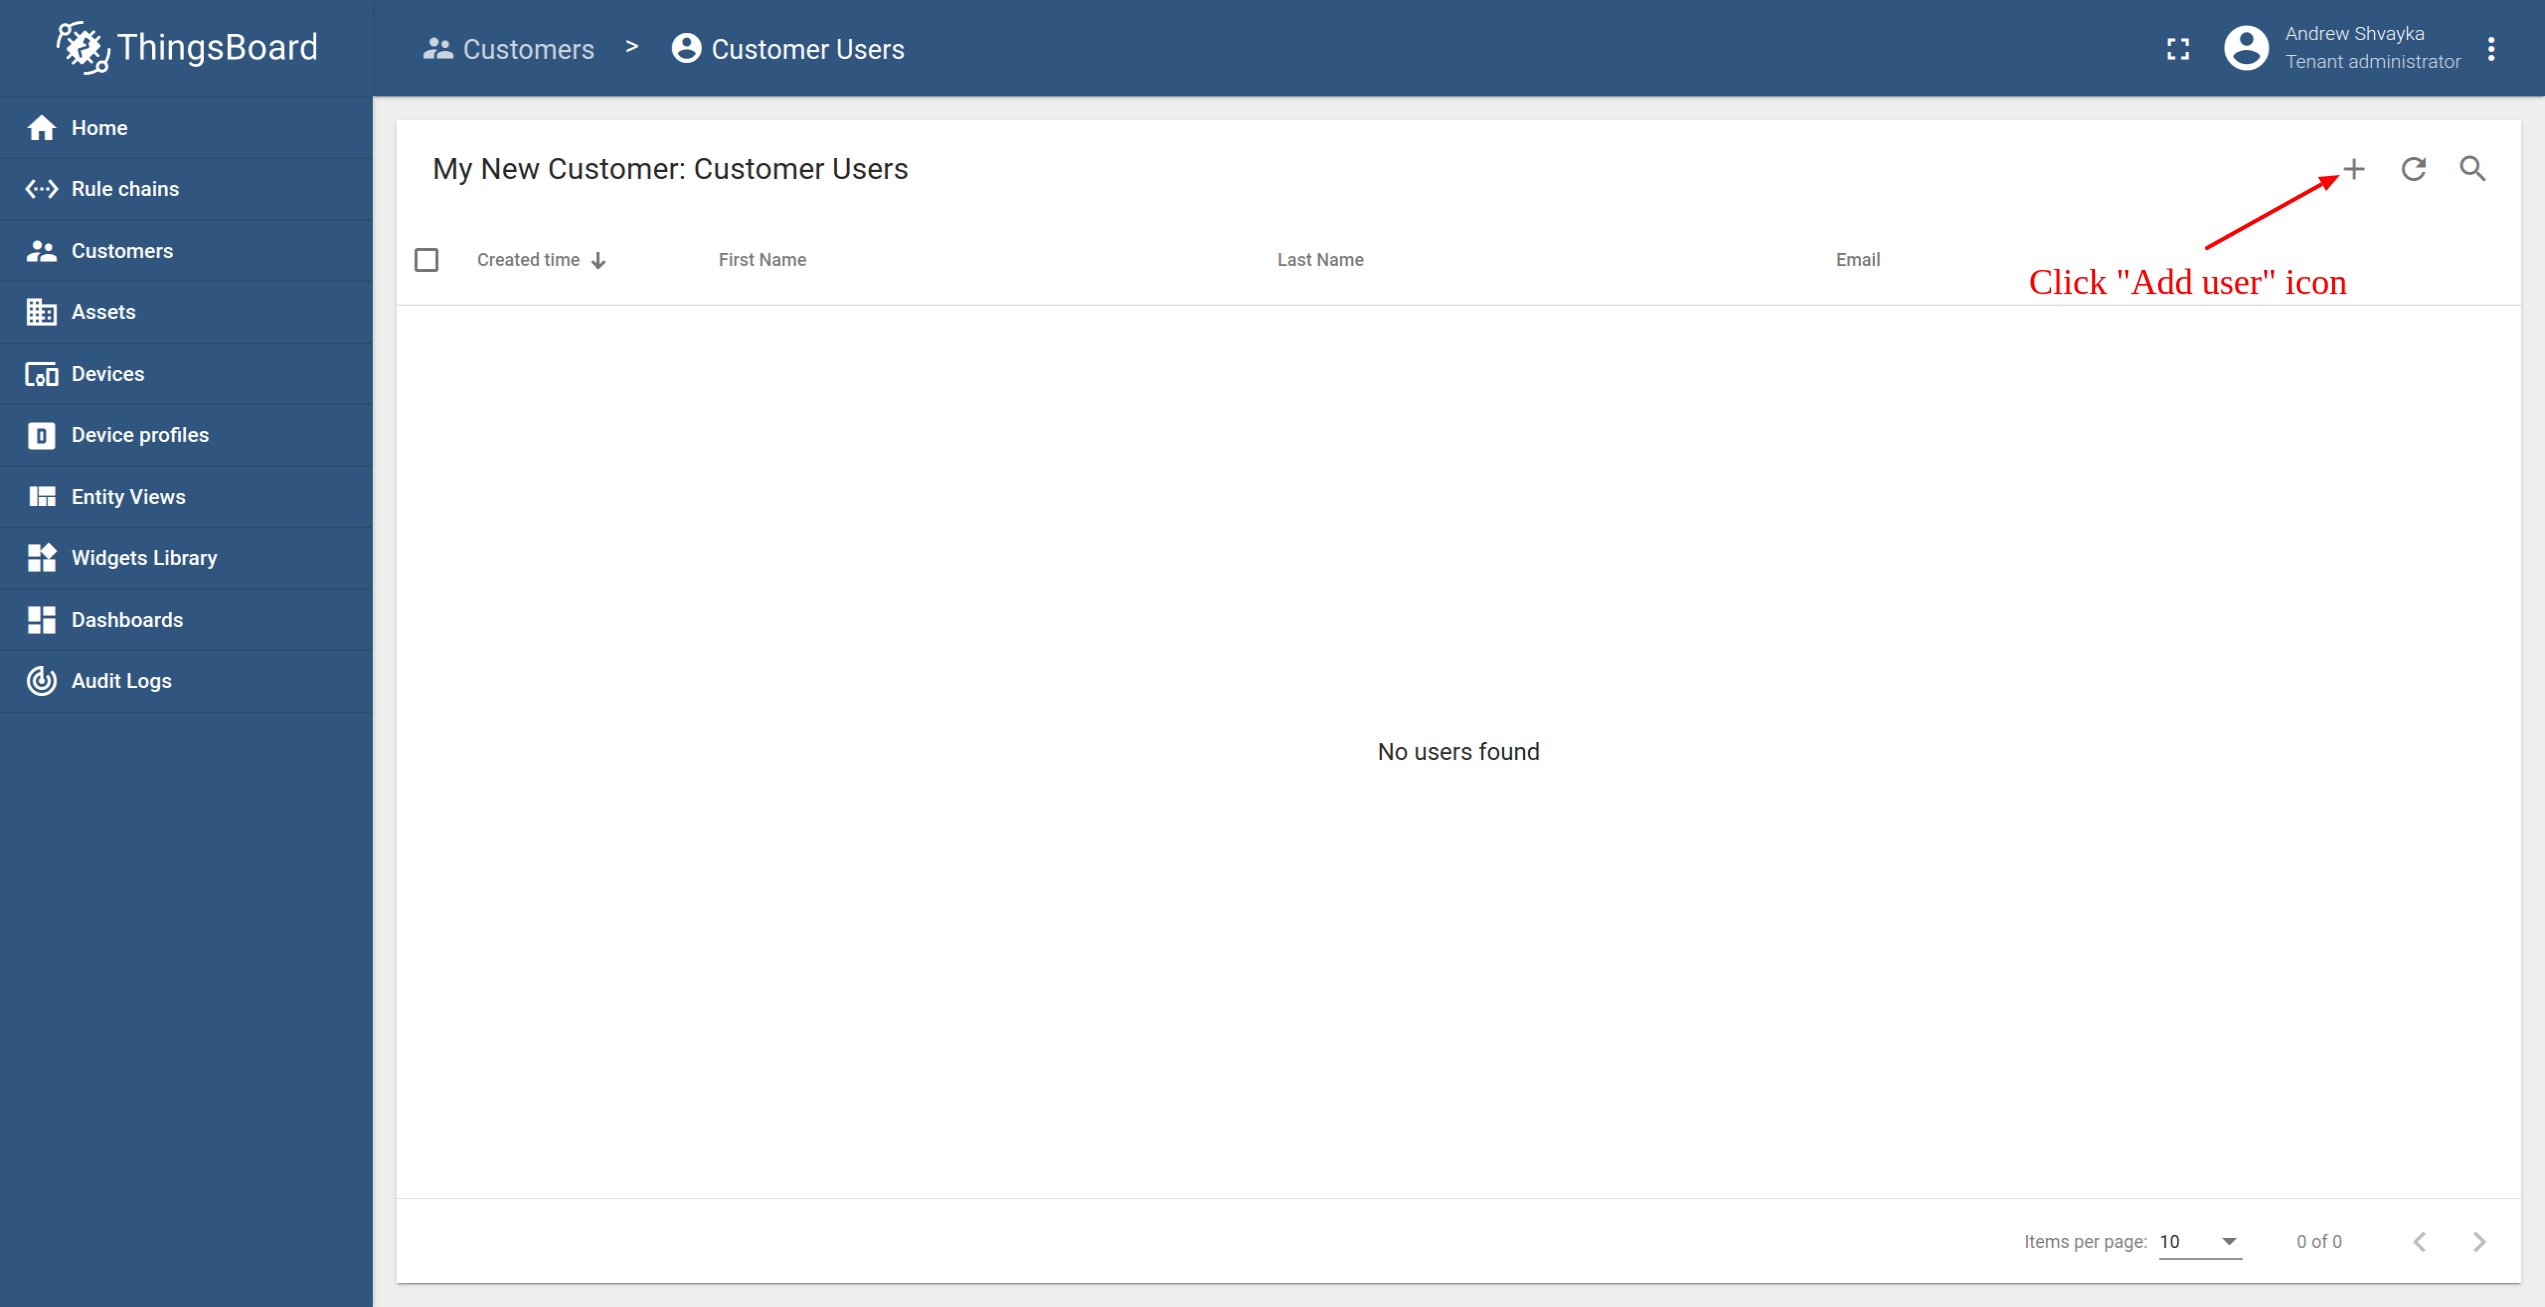
- Navigate back to the "Customers" page and click the "manage customer users" icon.
- Click the "Add user" icon.
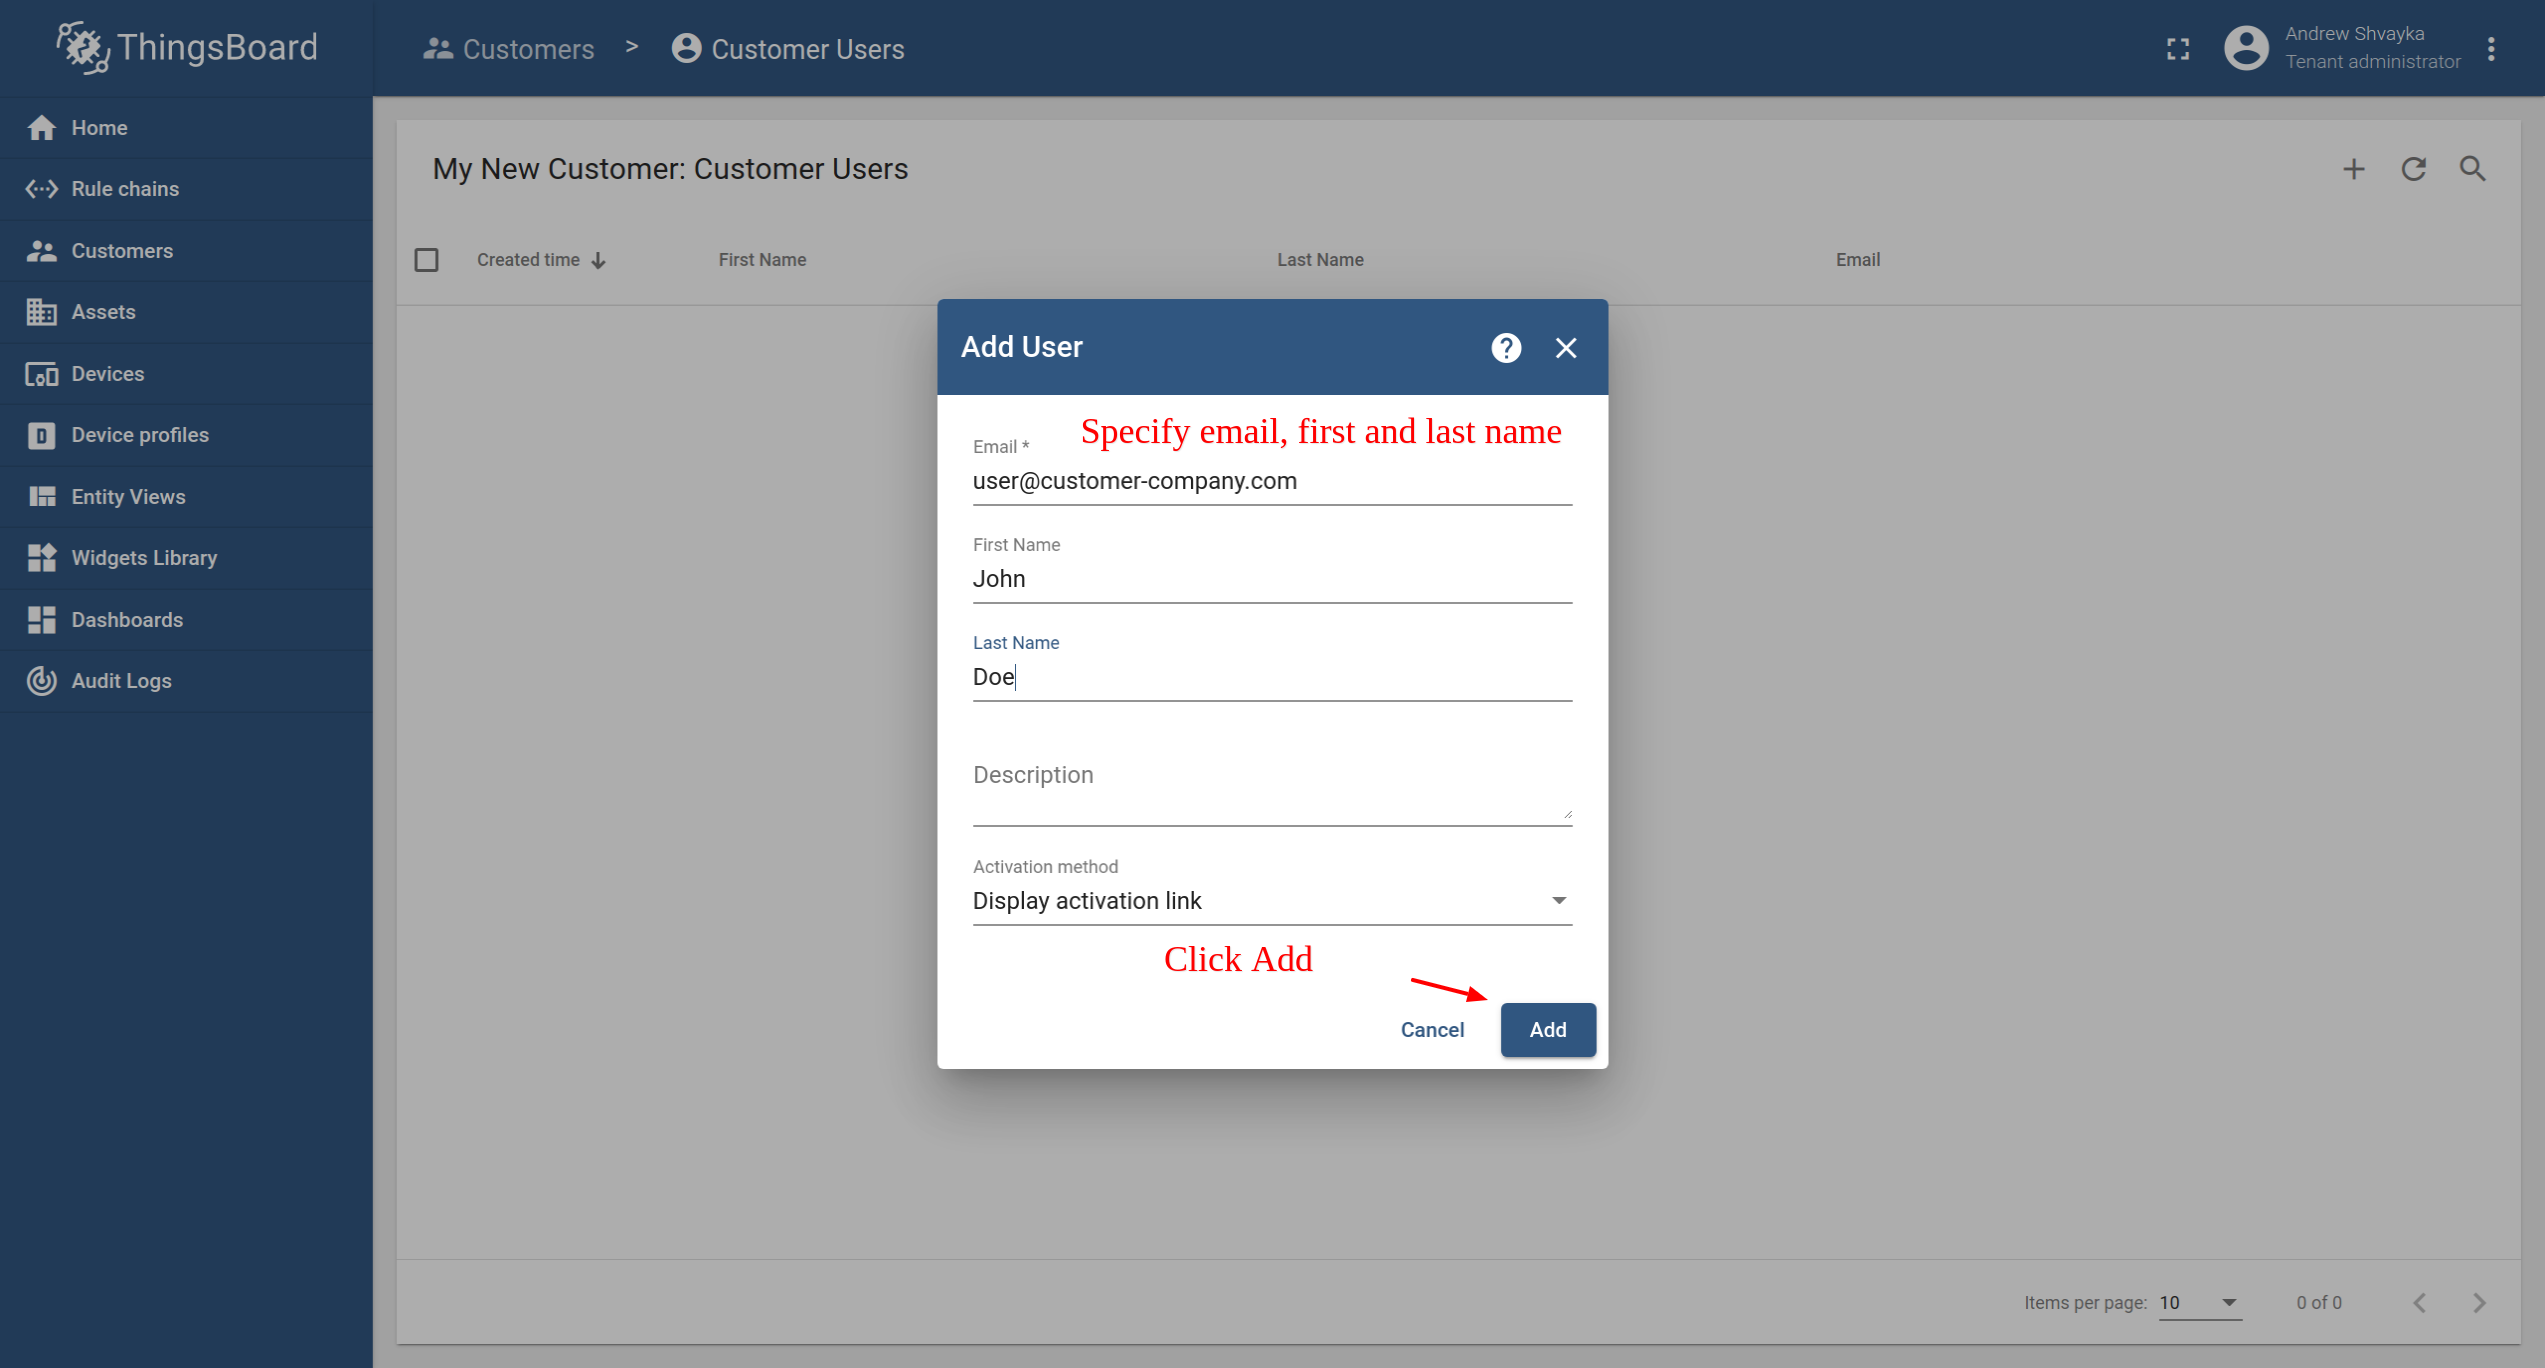
- Specify email that you will use to login as a customer user and click "Add".
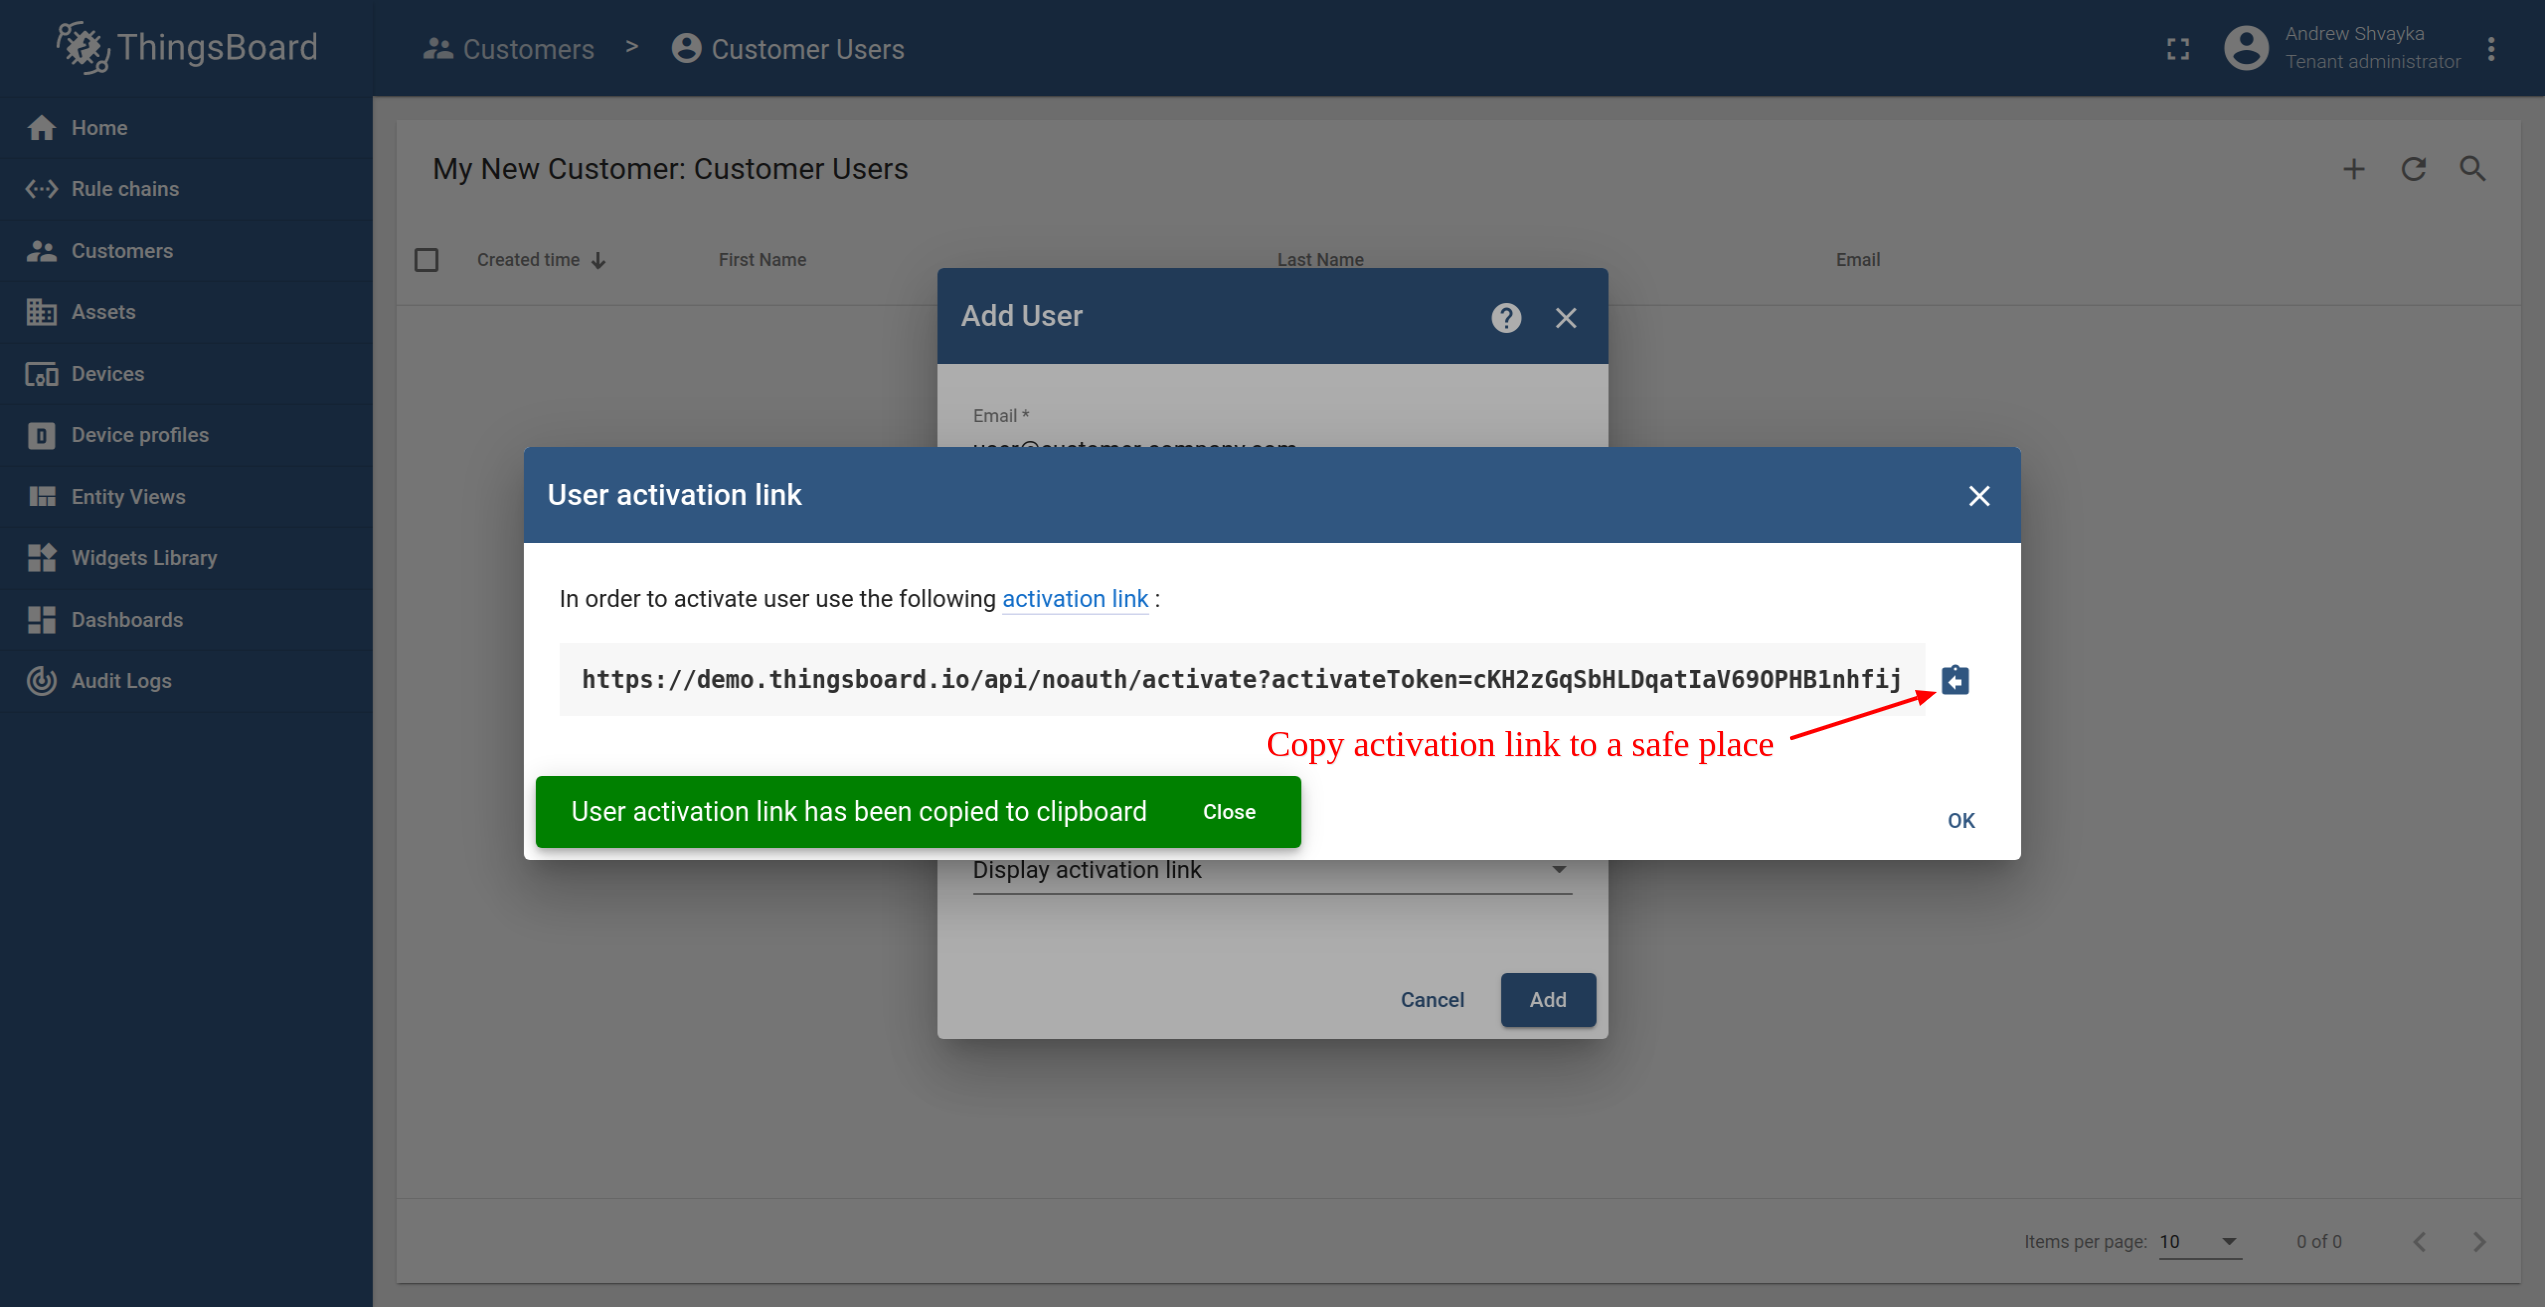
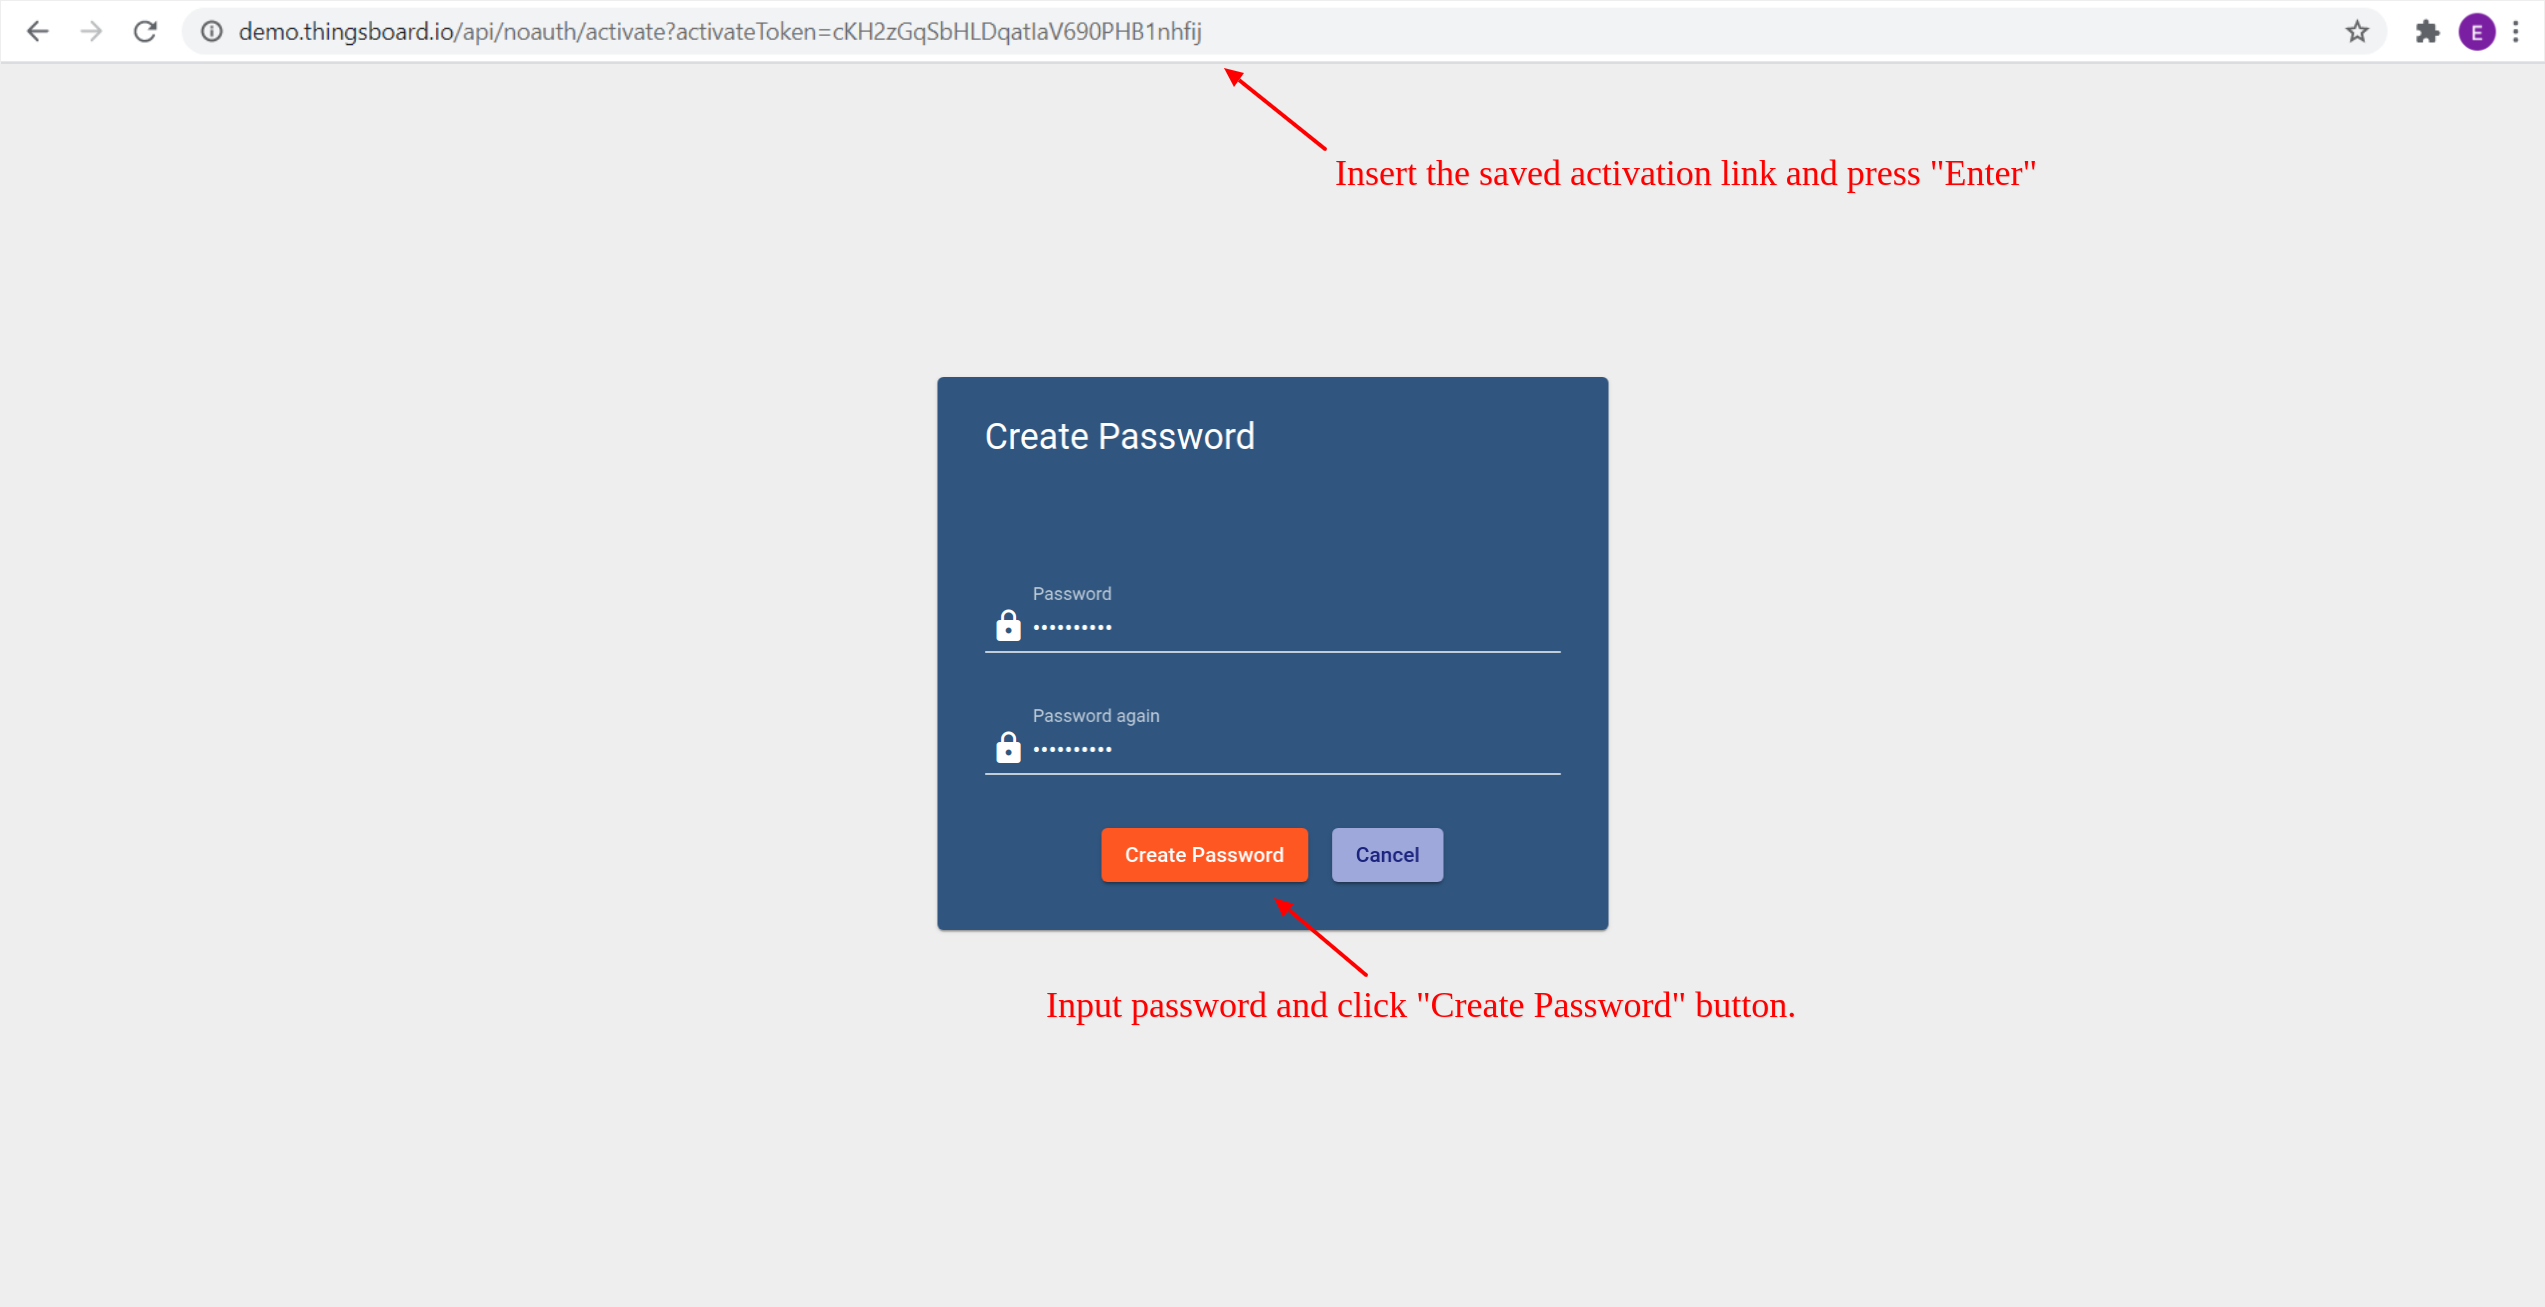
- Copy the activation link and save it to a safe place. You will use it later to set the password.
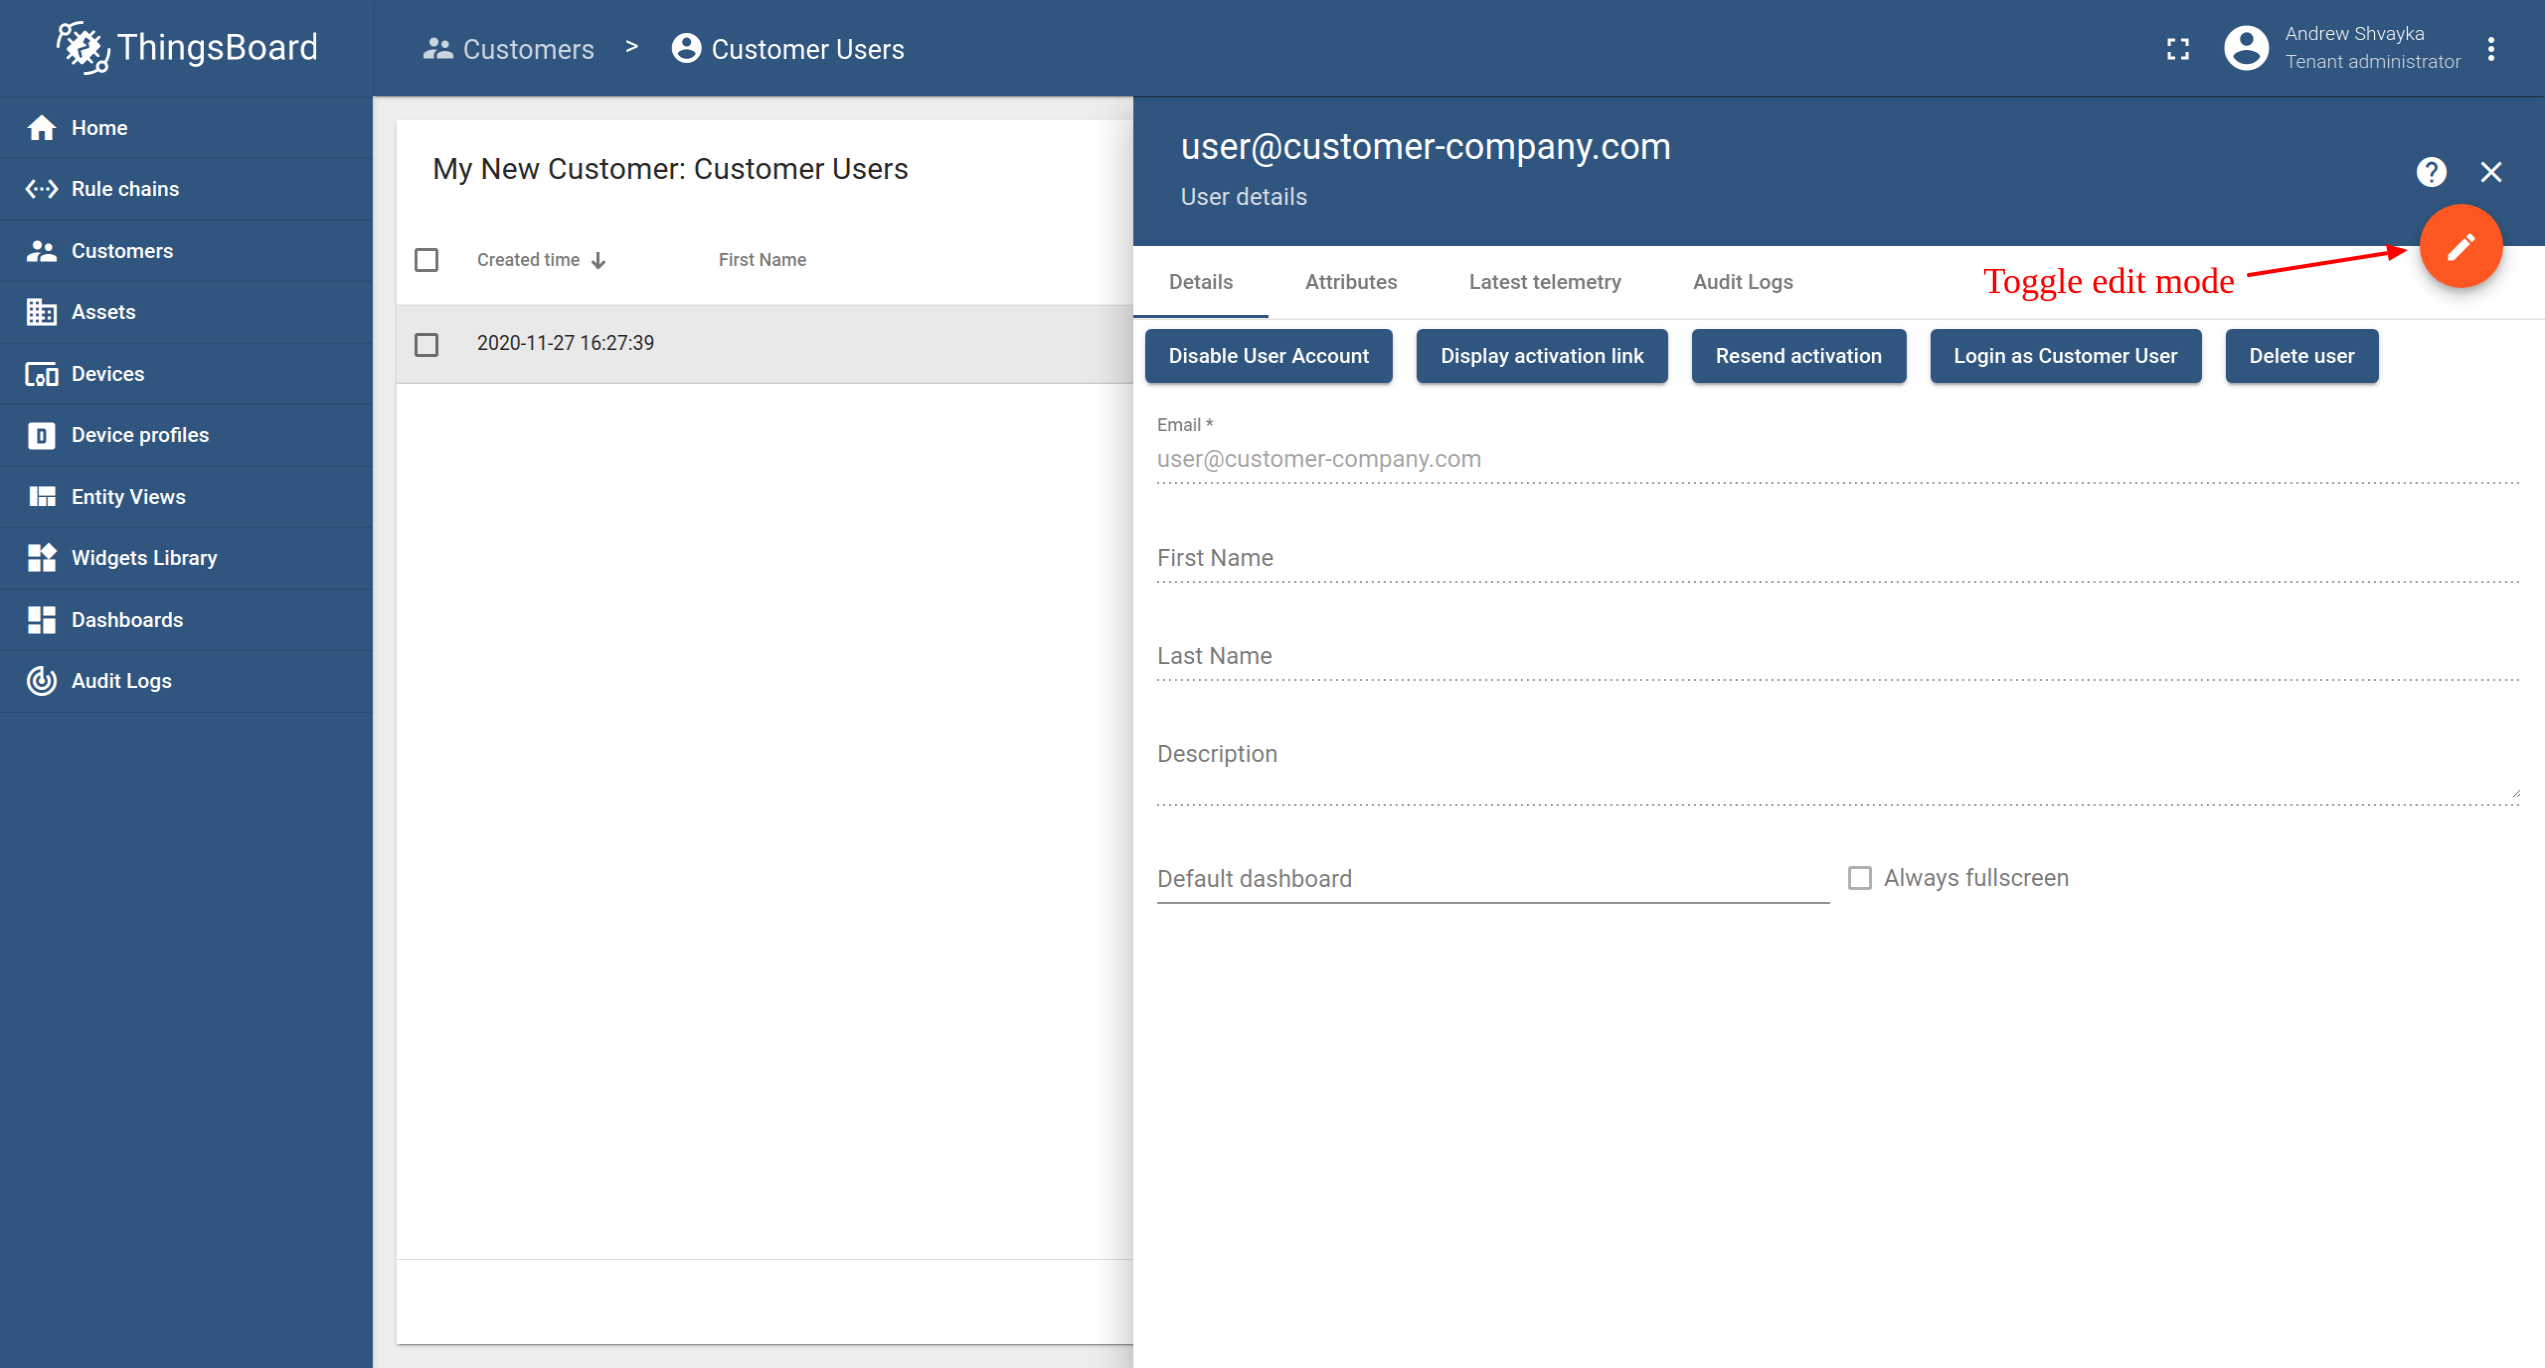
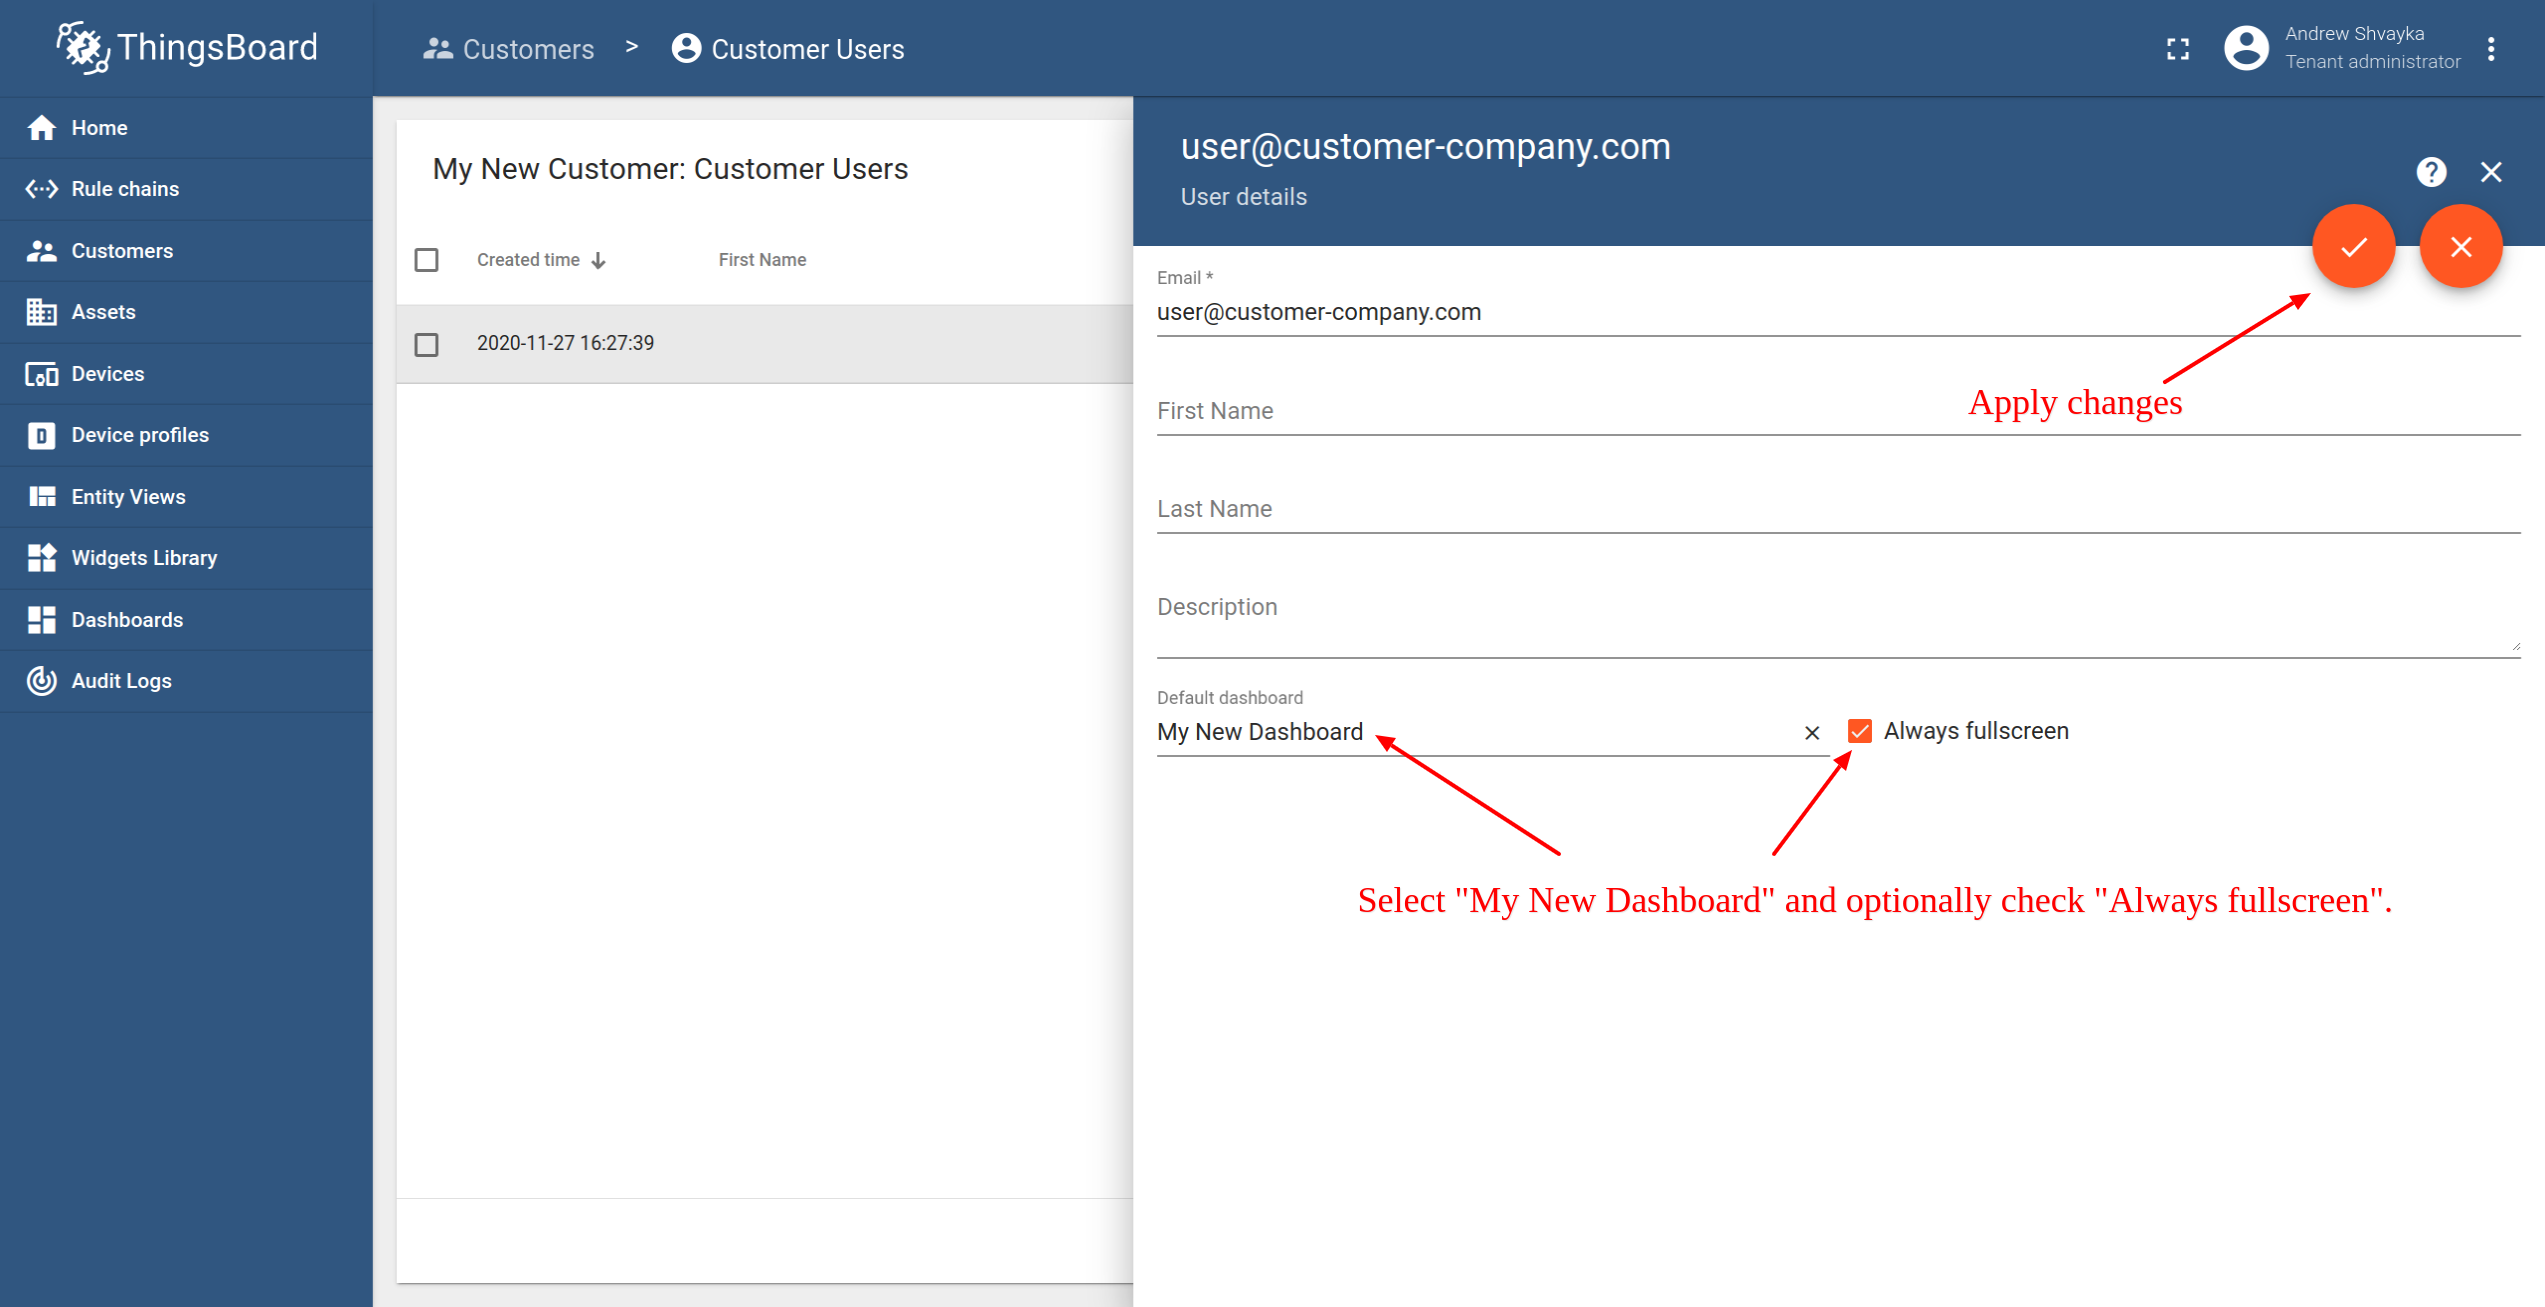
- Open user details.
- Toggle edit mode.
- Select default dashboard and check "Always fullscreen". Apply changes.

Passo 7.5 Ativar usuário cliente
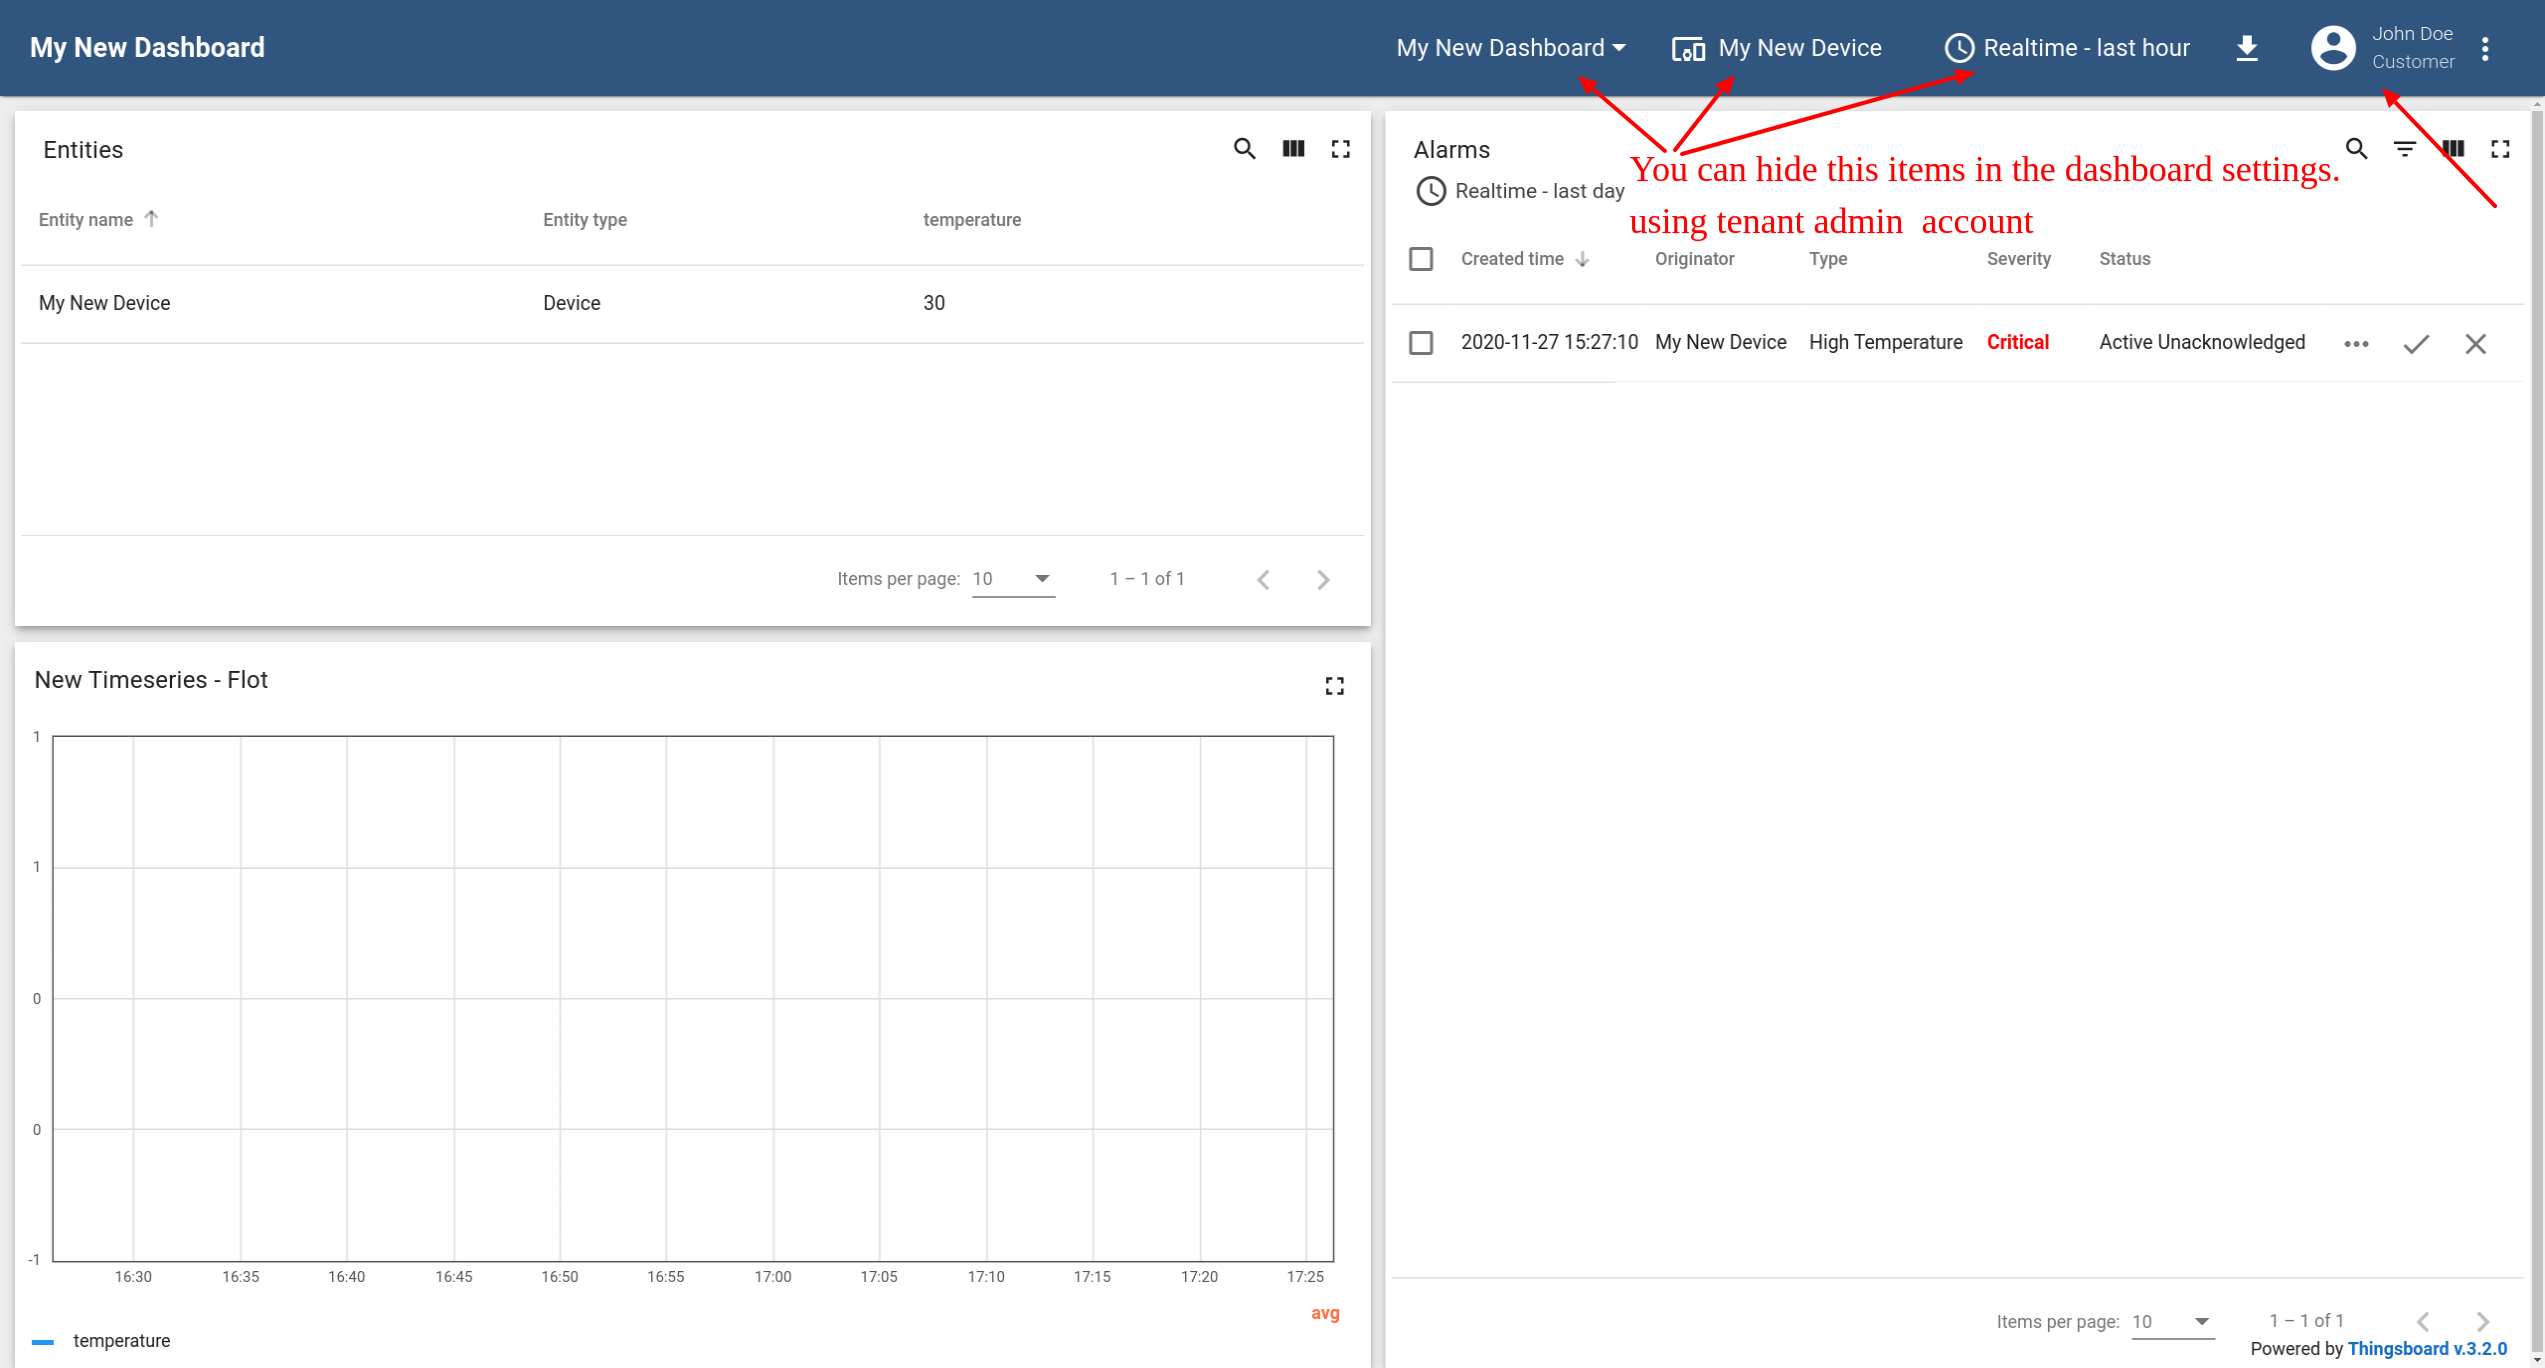
- Use the activation link to set the password. Click "Create Password". You will automatically login as a customer user.
- Você se conectou como um usuário cliente. Você pode navegar pelos dados e reconhecer / limpar alarmes.
-
Guias de Instalação - Aprenda a configurar o RETINA em vários sistemas operacionais disponíveis.
-
Connect your device - Learn how to connect devices based on your connectivity technology or solution.
-
Data visualization - These guides contain instructions how to configure complex ThingsBoard dashboards.
-
Data processing & actions - Learn how to use Mecanismo de Regra RETINA.
-
IoT Data analytics - Learn how to use rule engine to perform basic analytics tasks.
-
amostras de hardware - Learn how to connect various hardware platforms to ThingsBoard.
-
Advanced features - Learn about advanced ThingsBoard features.
-
Contribution and Development - Learn about contribution and development in ThingsBoard.